
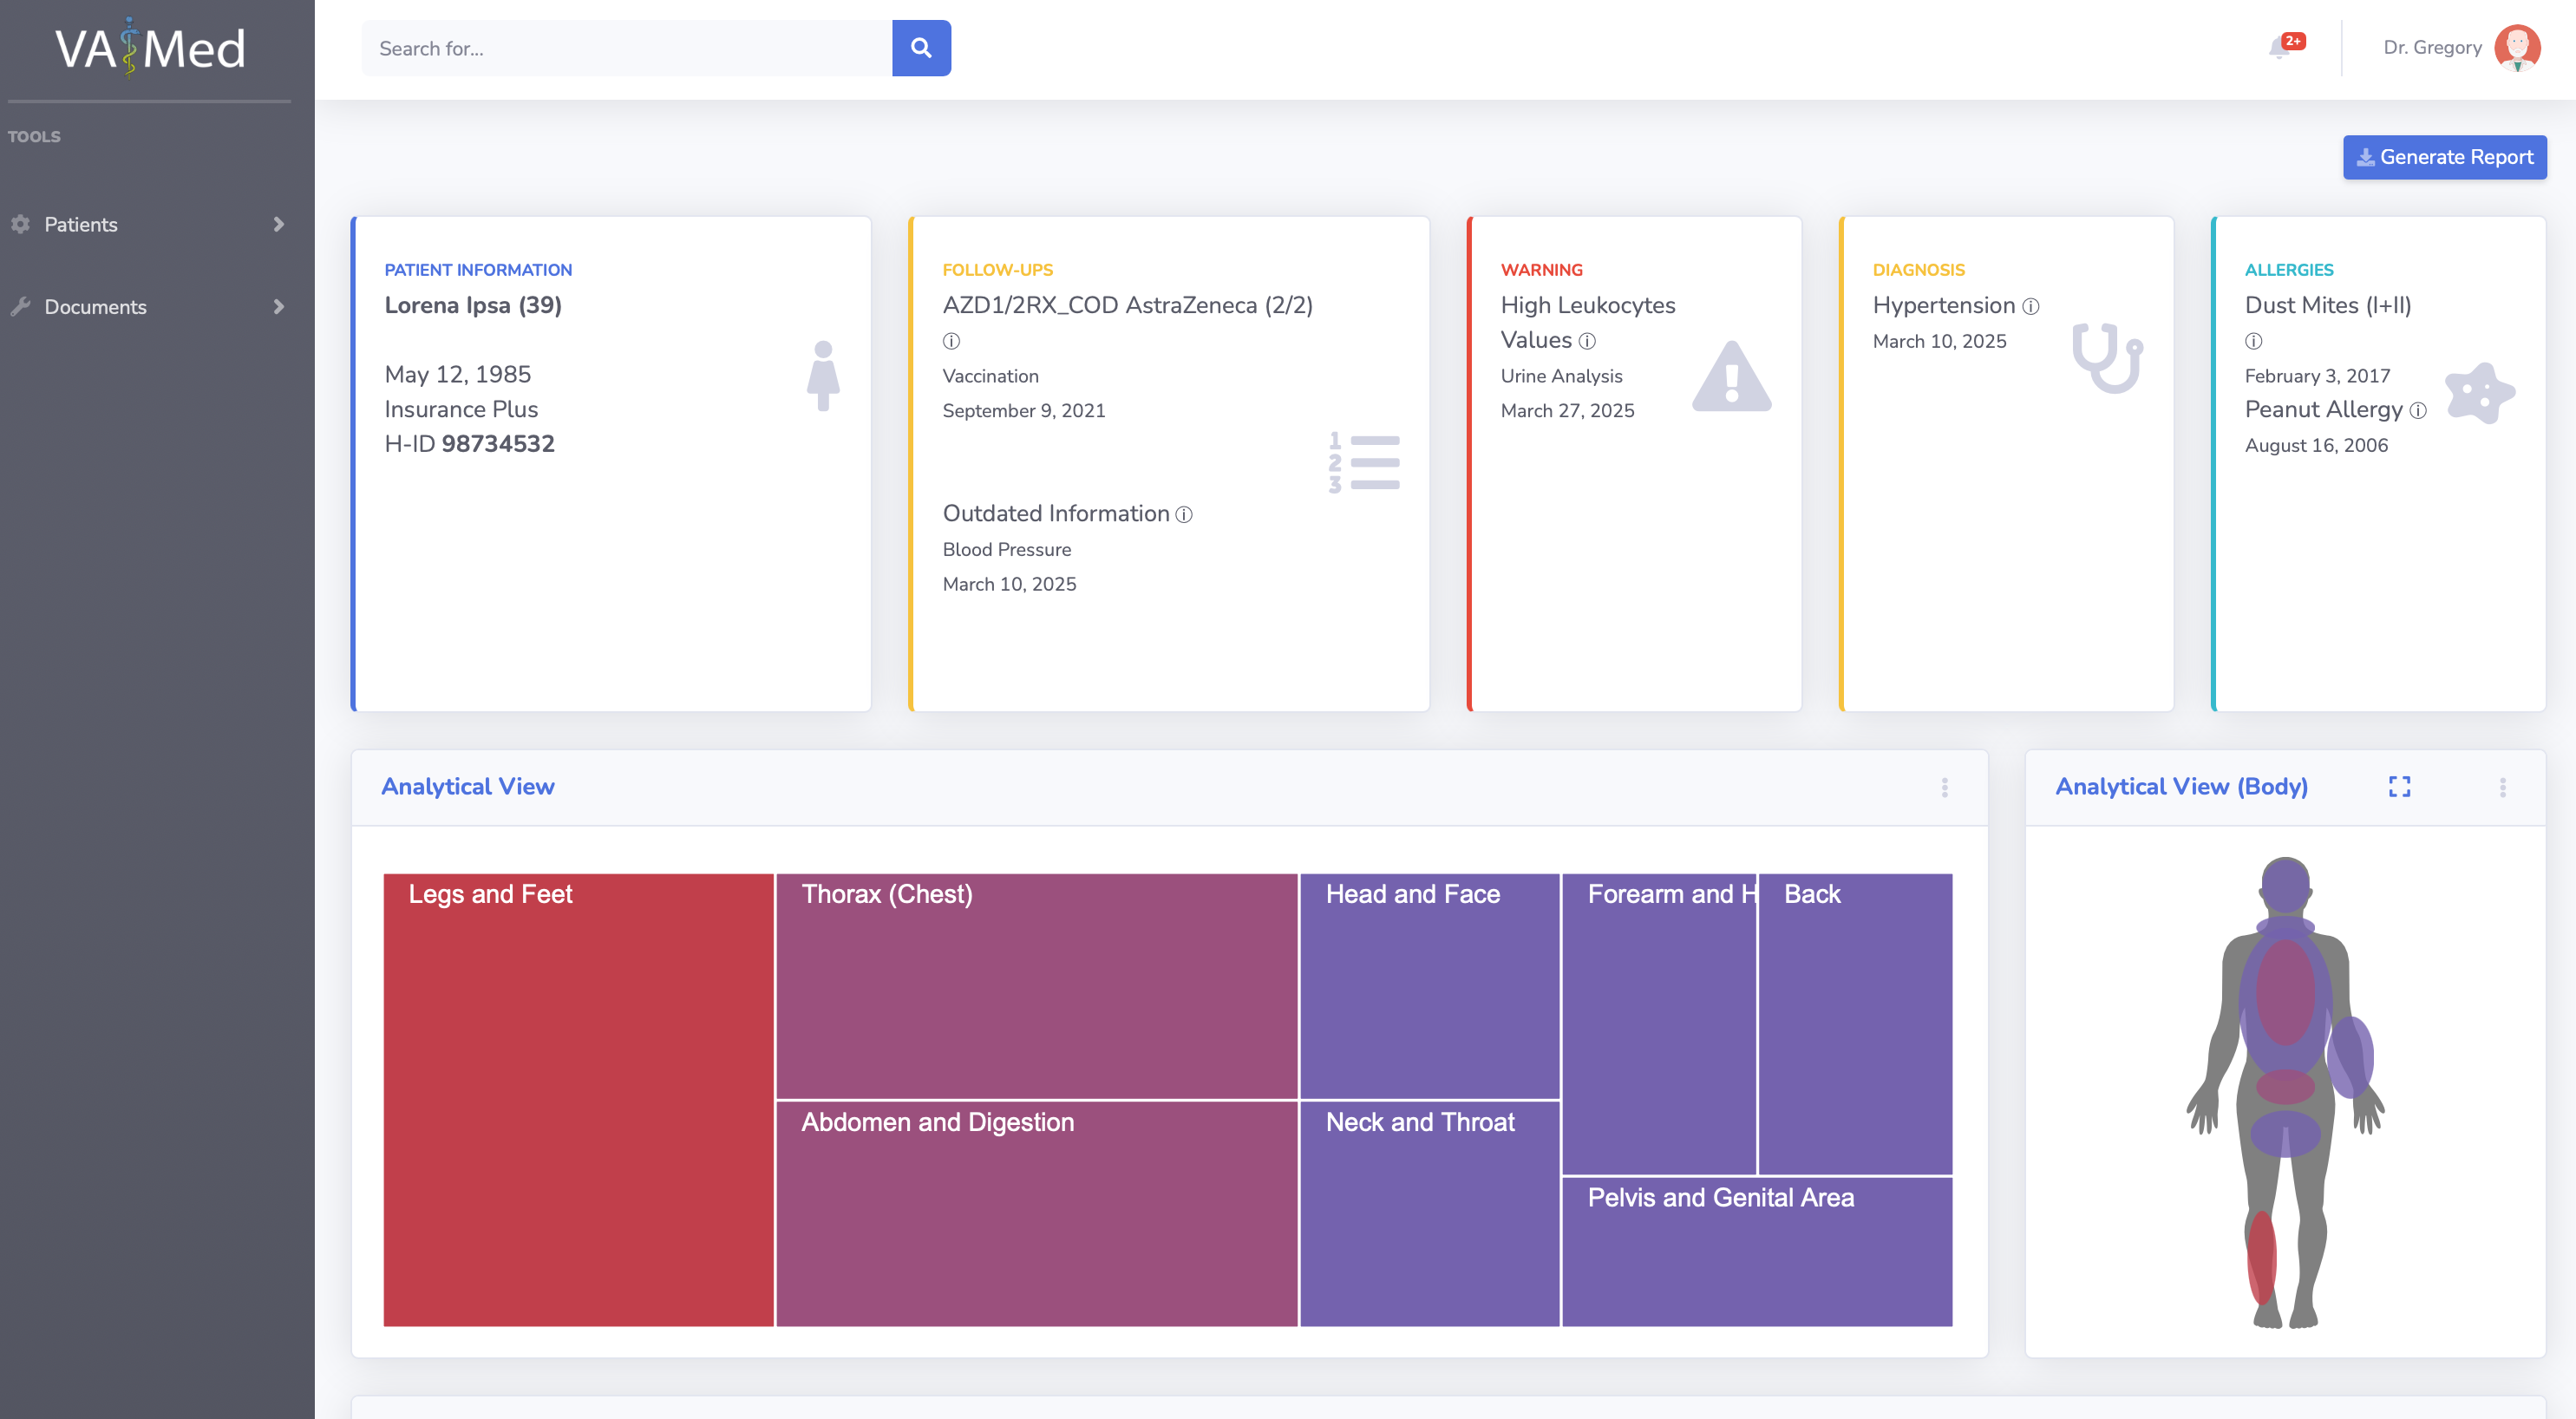
VAMED - Medical Dashboard
current version of VAMED Dashboard
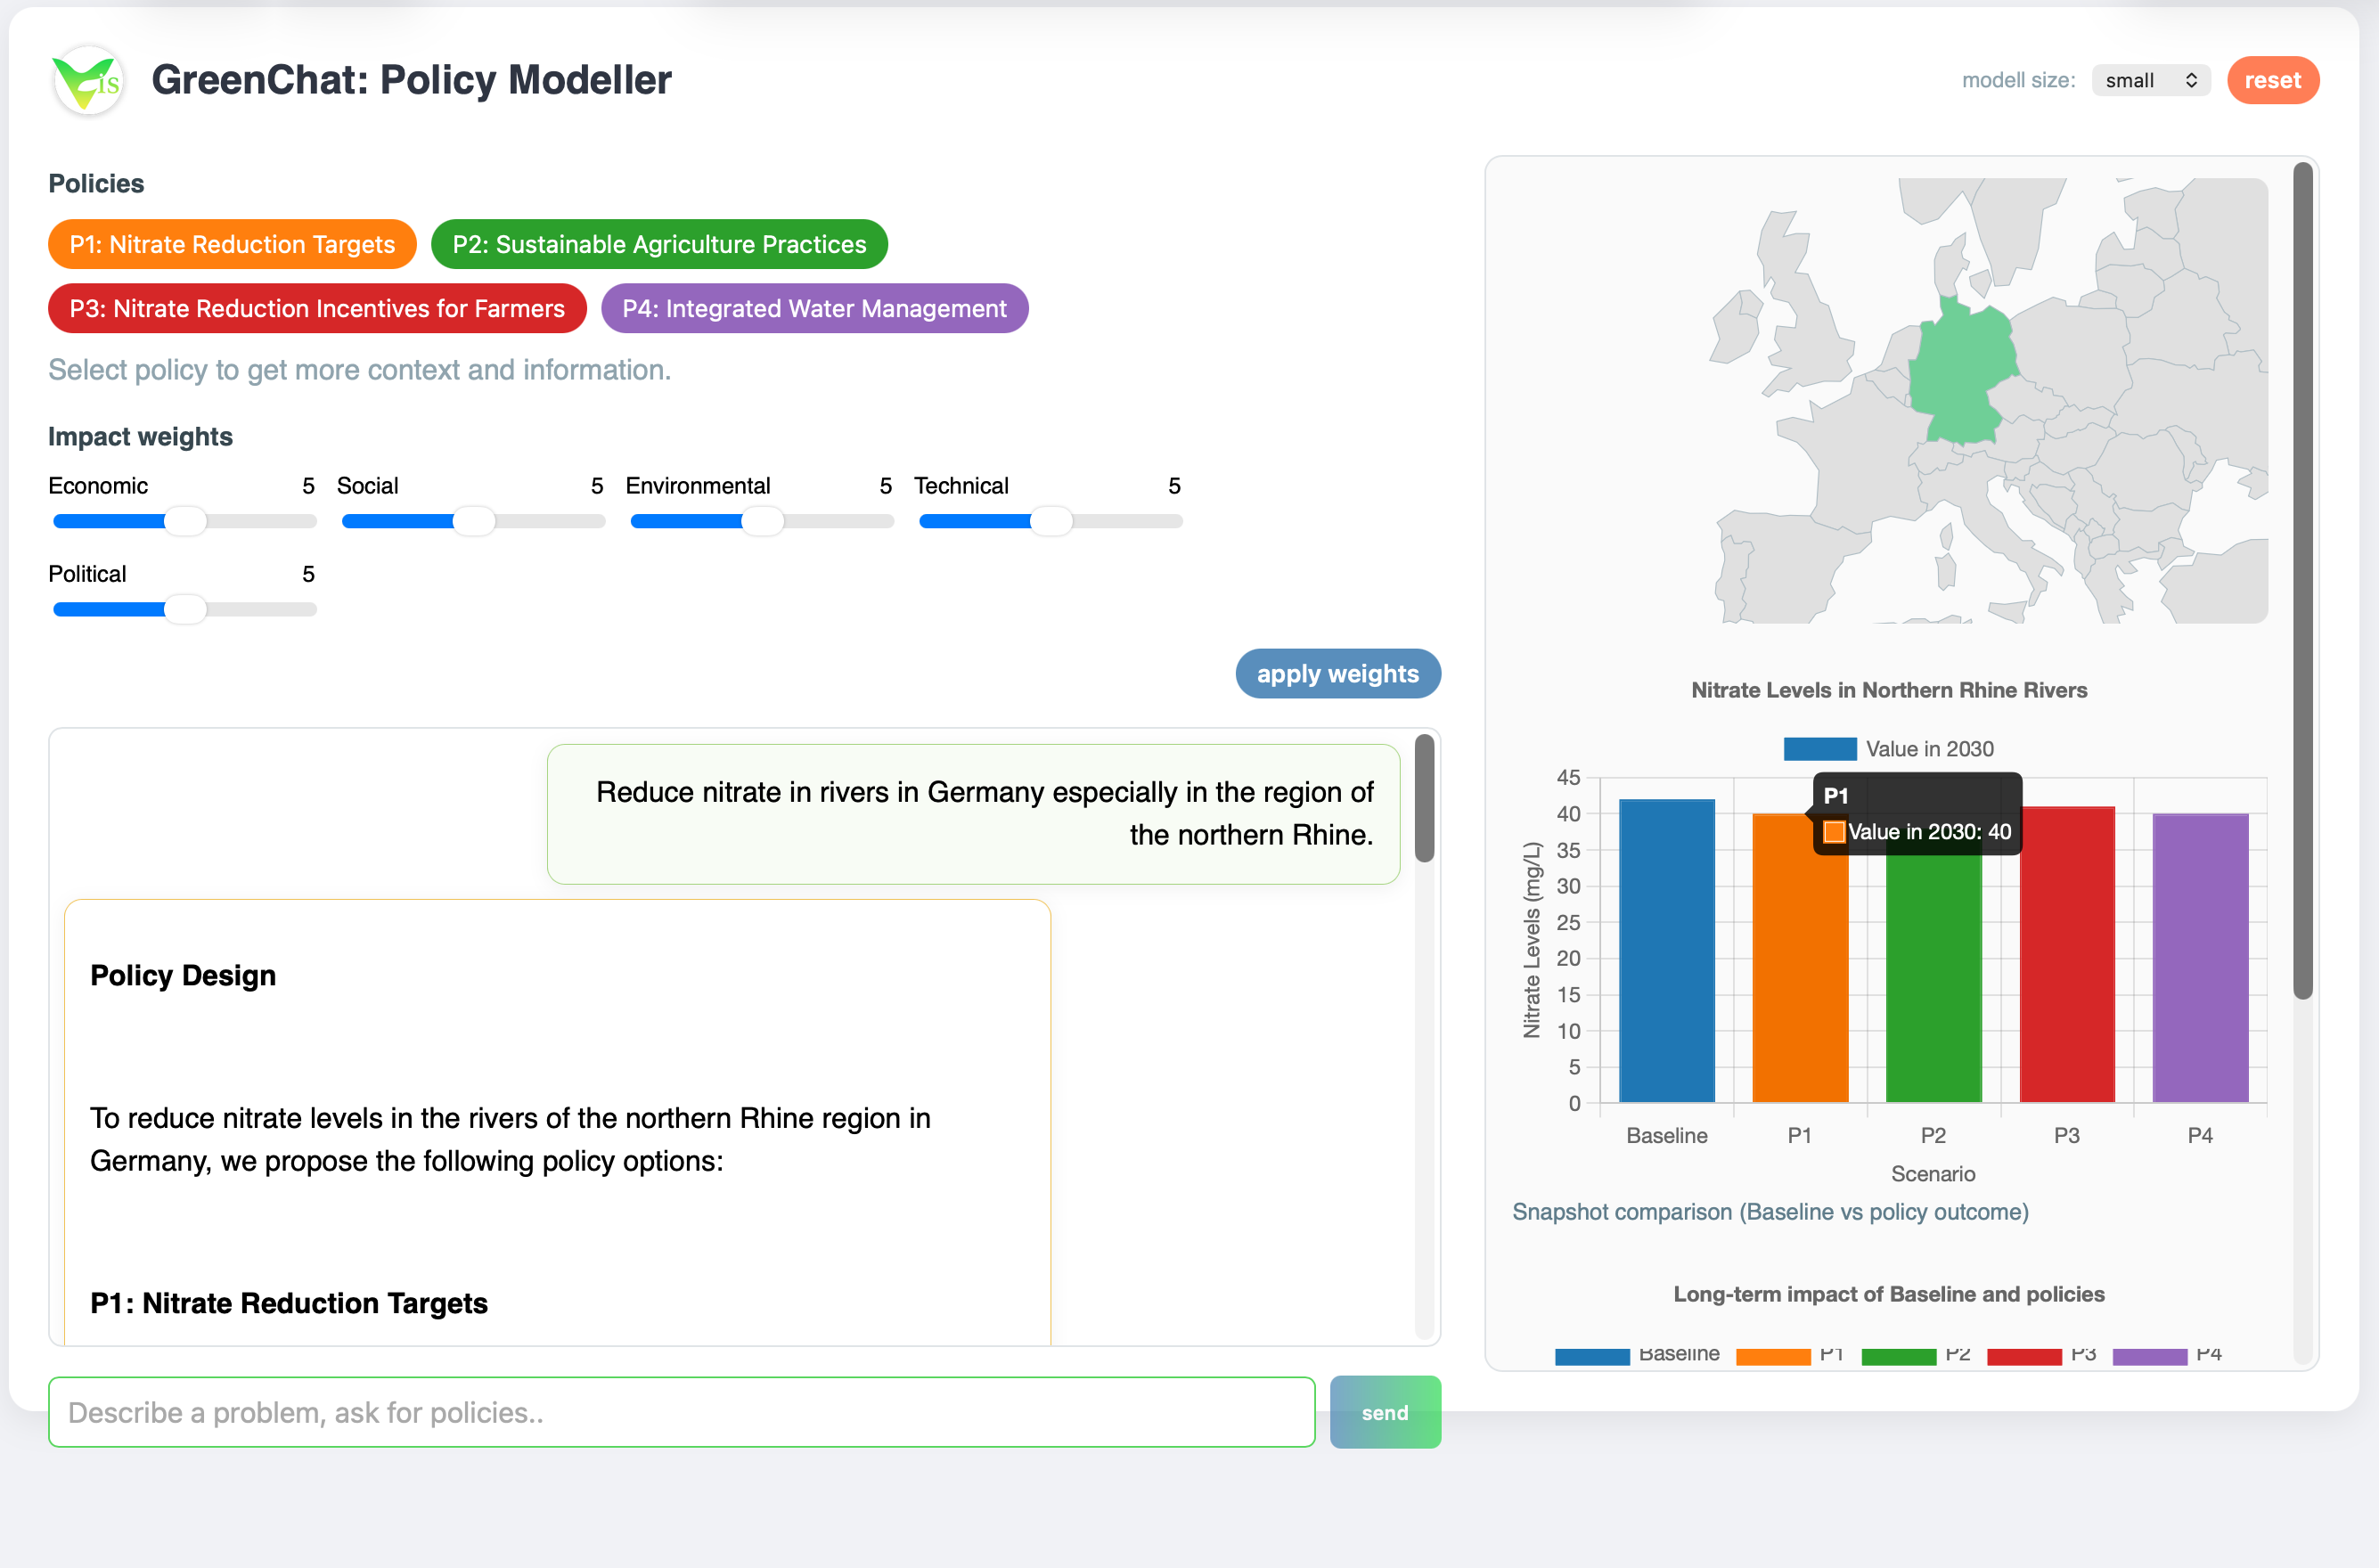
GreenChat: Policy Modeller
Chatbot for sustainable work with policy modeling. It support text and visualization outputs.
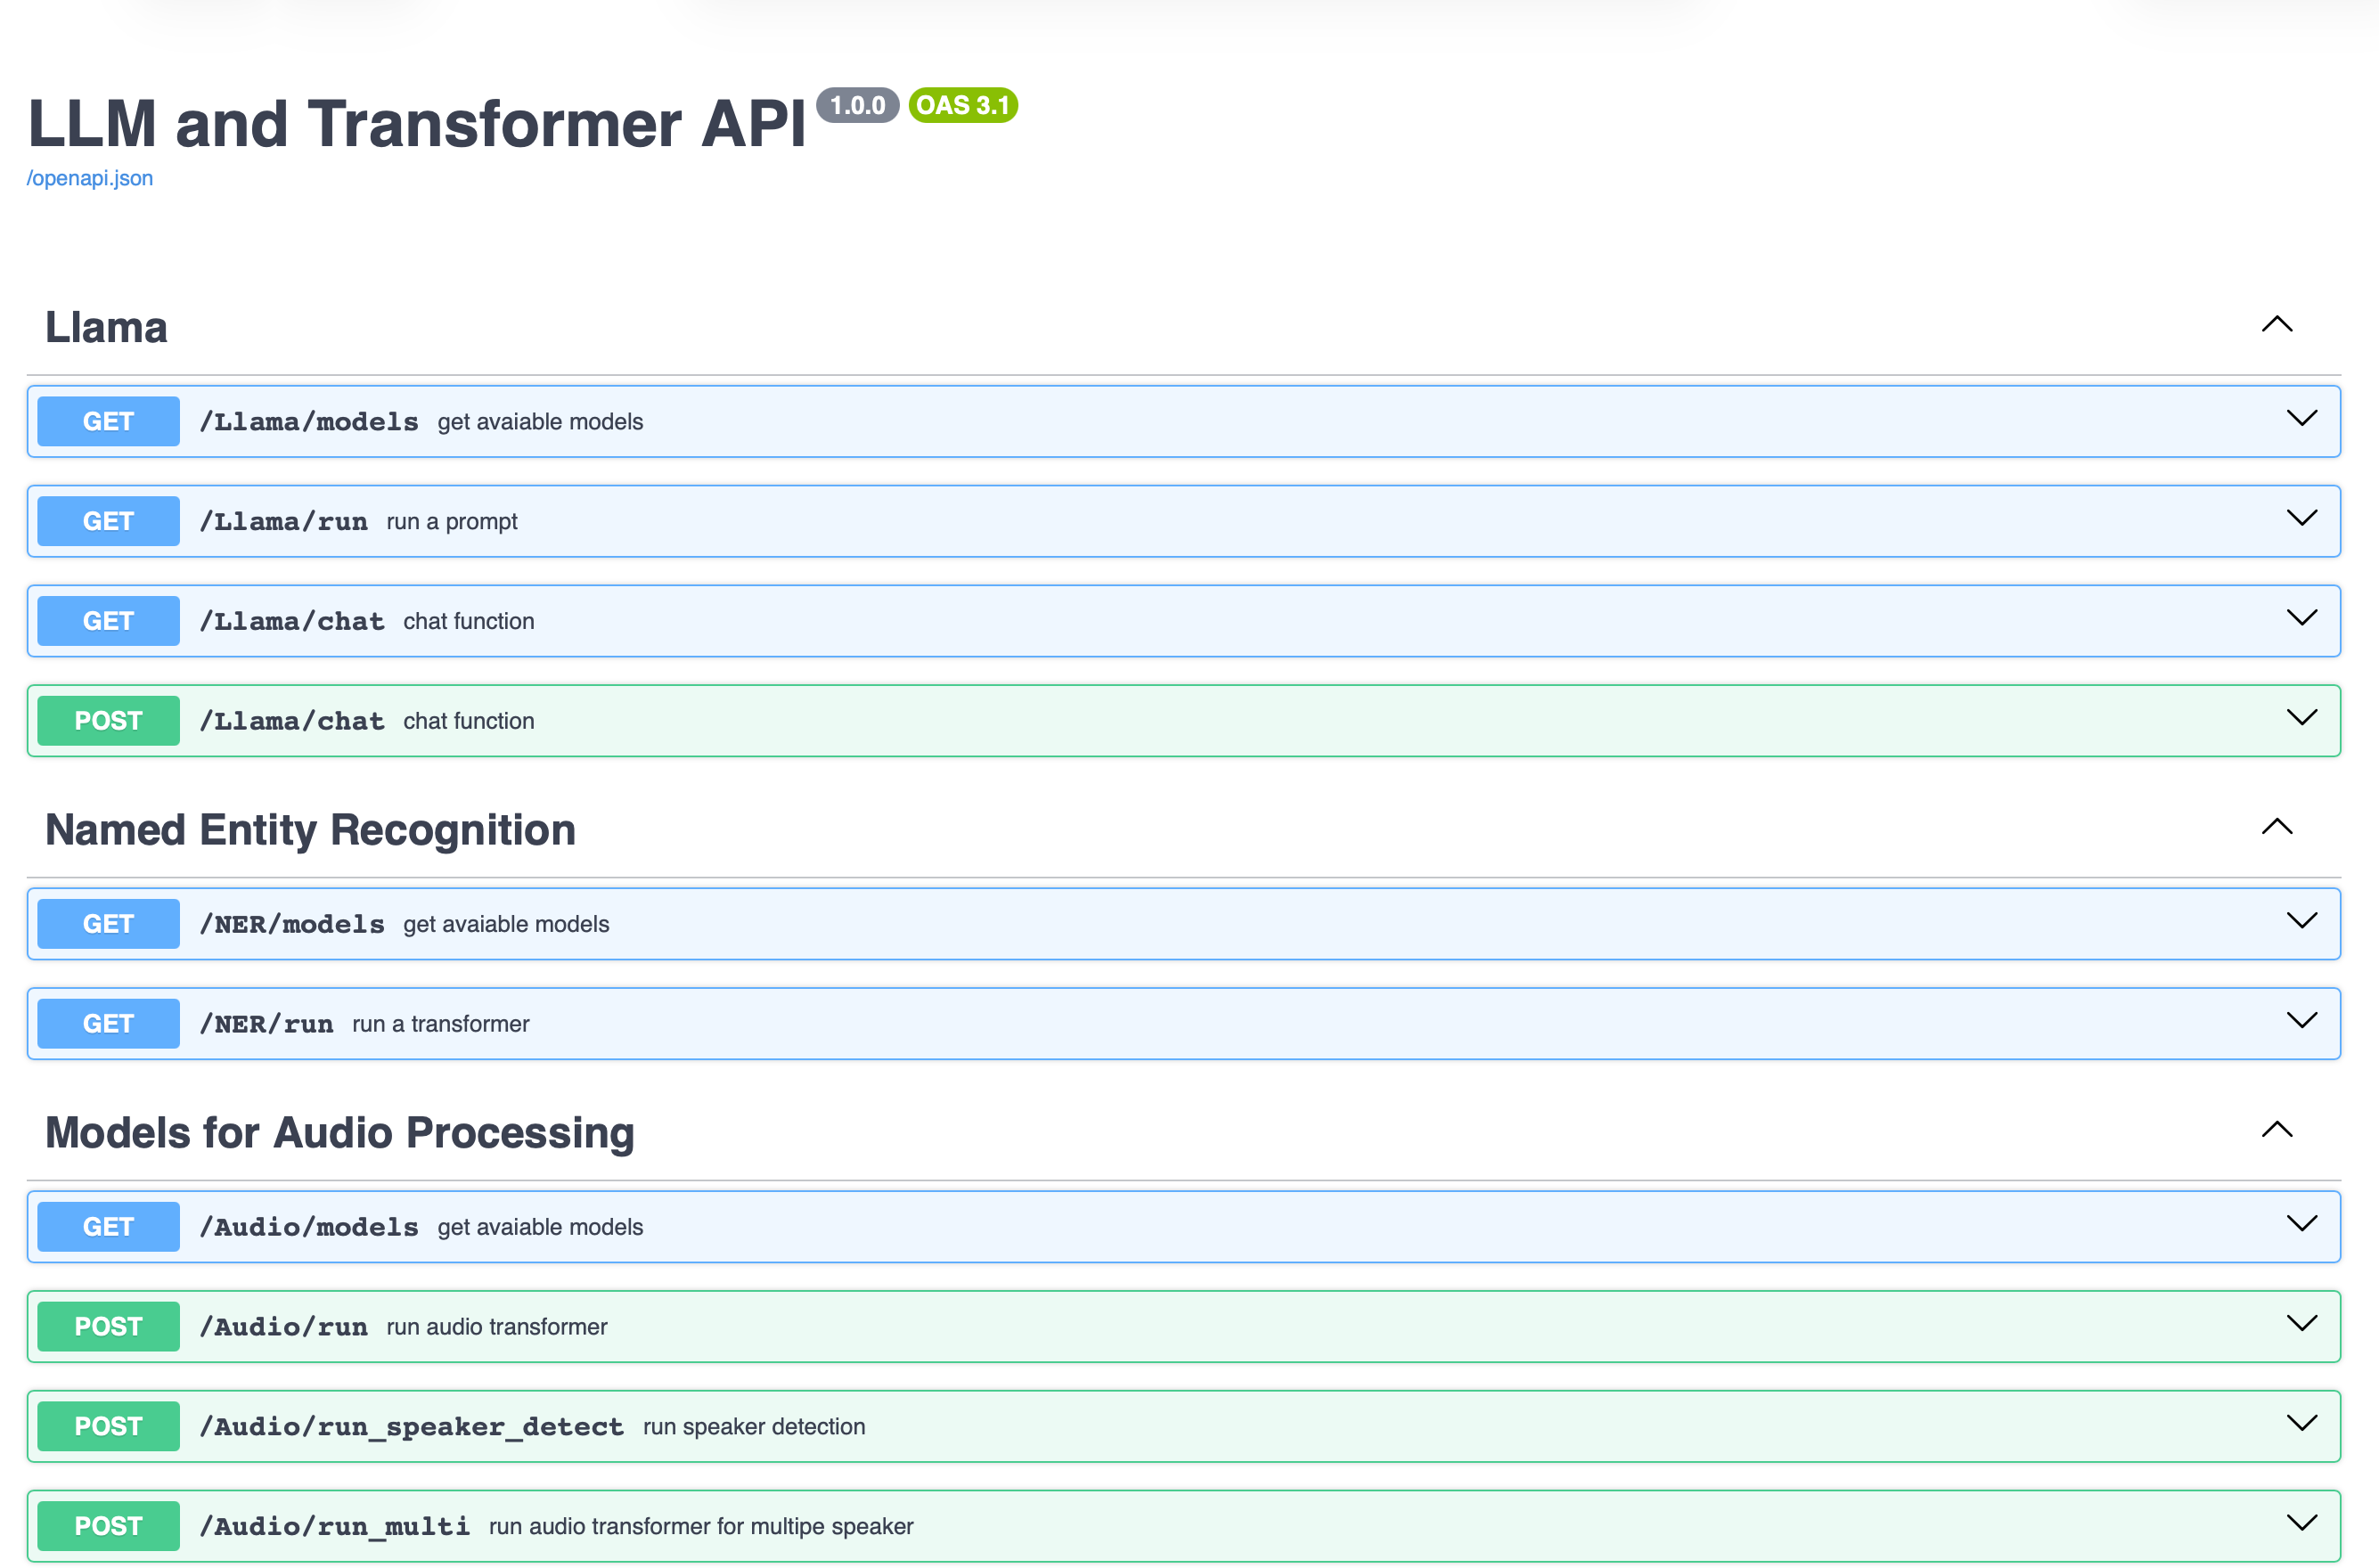
LLM and Transformer API
API for LLM, Transformer and NNs
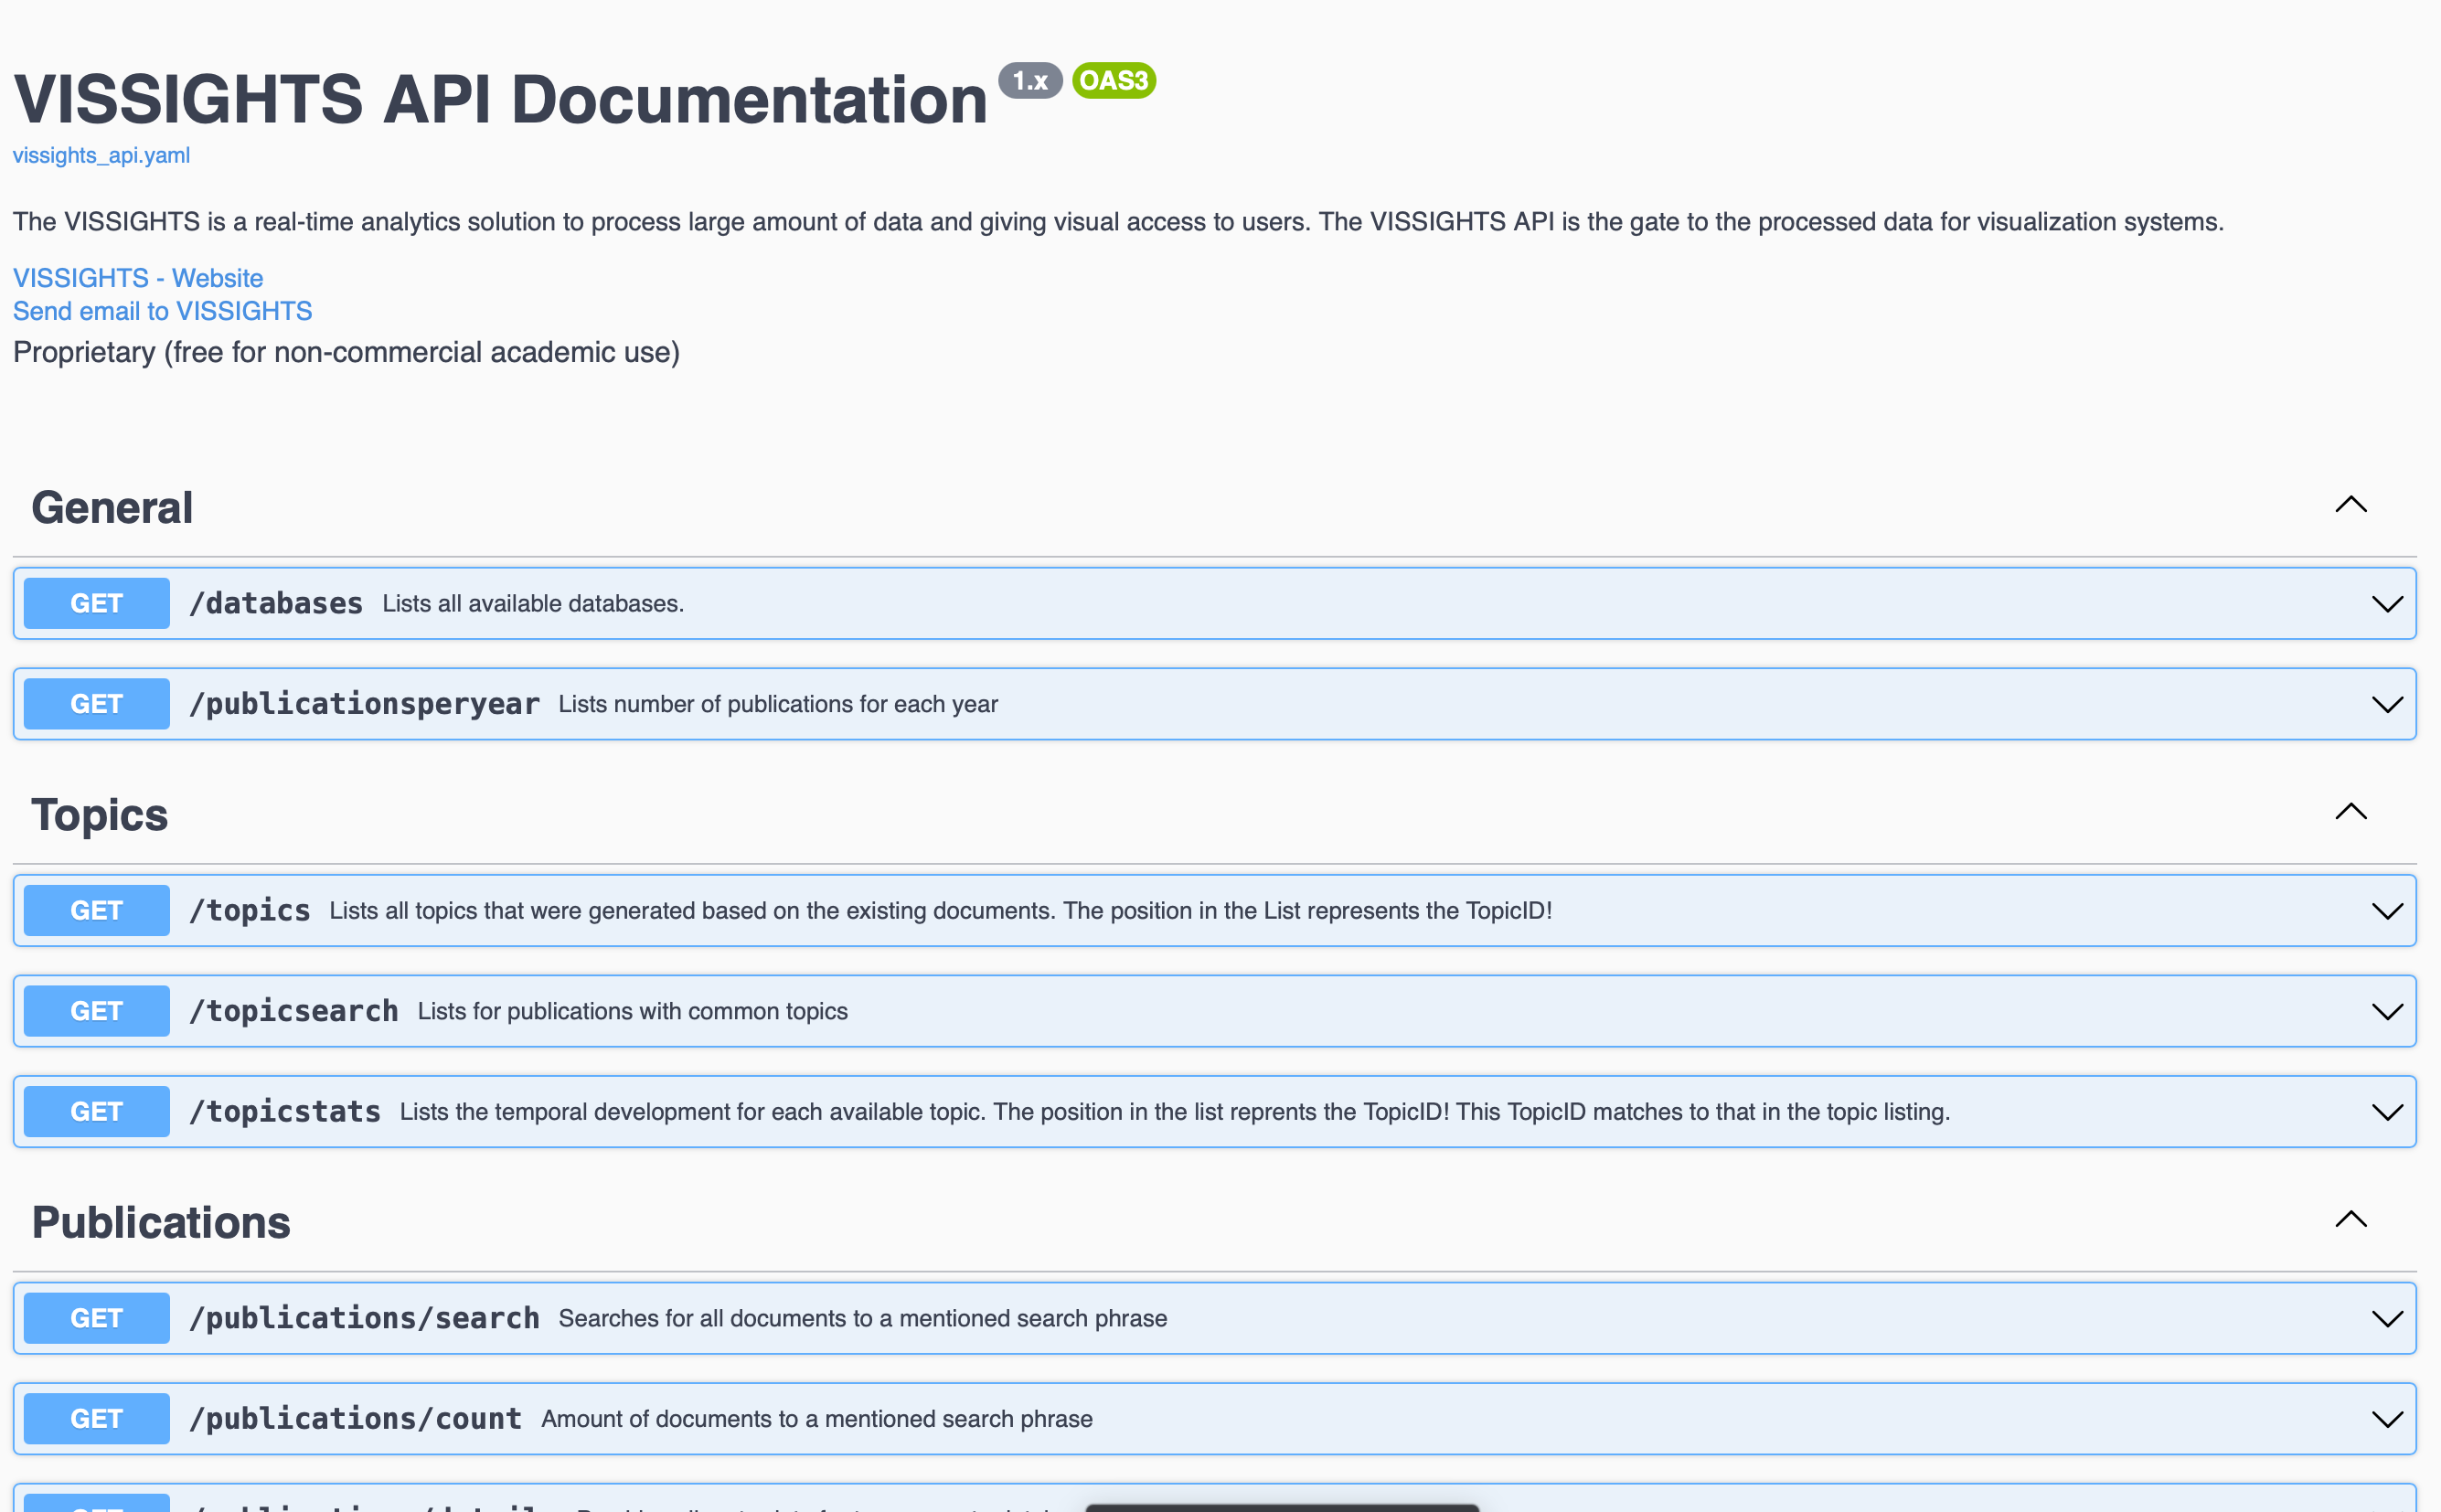
VISSIGHTS API Documentation
The VISSIGHTS API is a real-time analytics solution to process large amount of data and giving visual access to users. The VISSIGHTS API is the gate to the processed data for visualization systems.
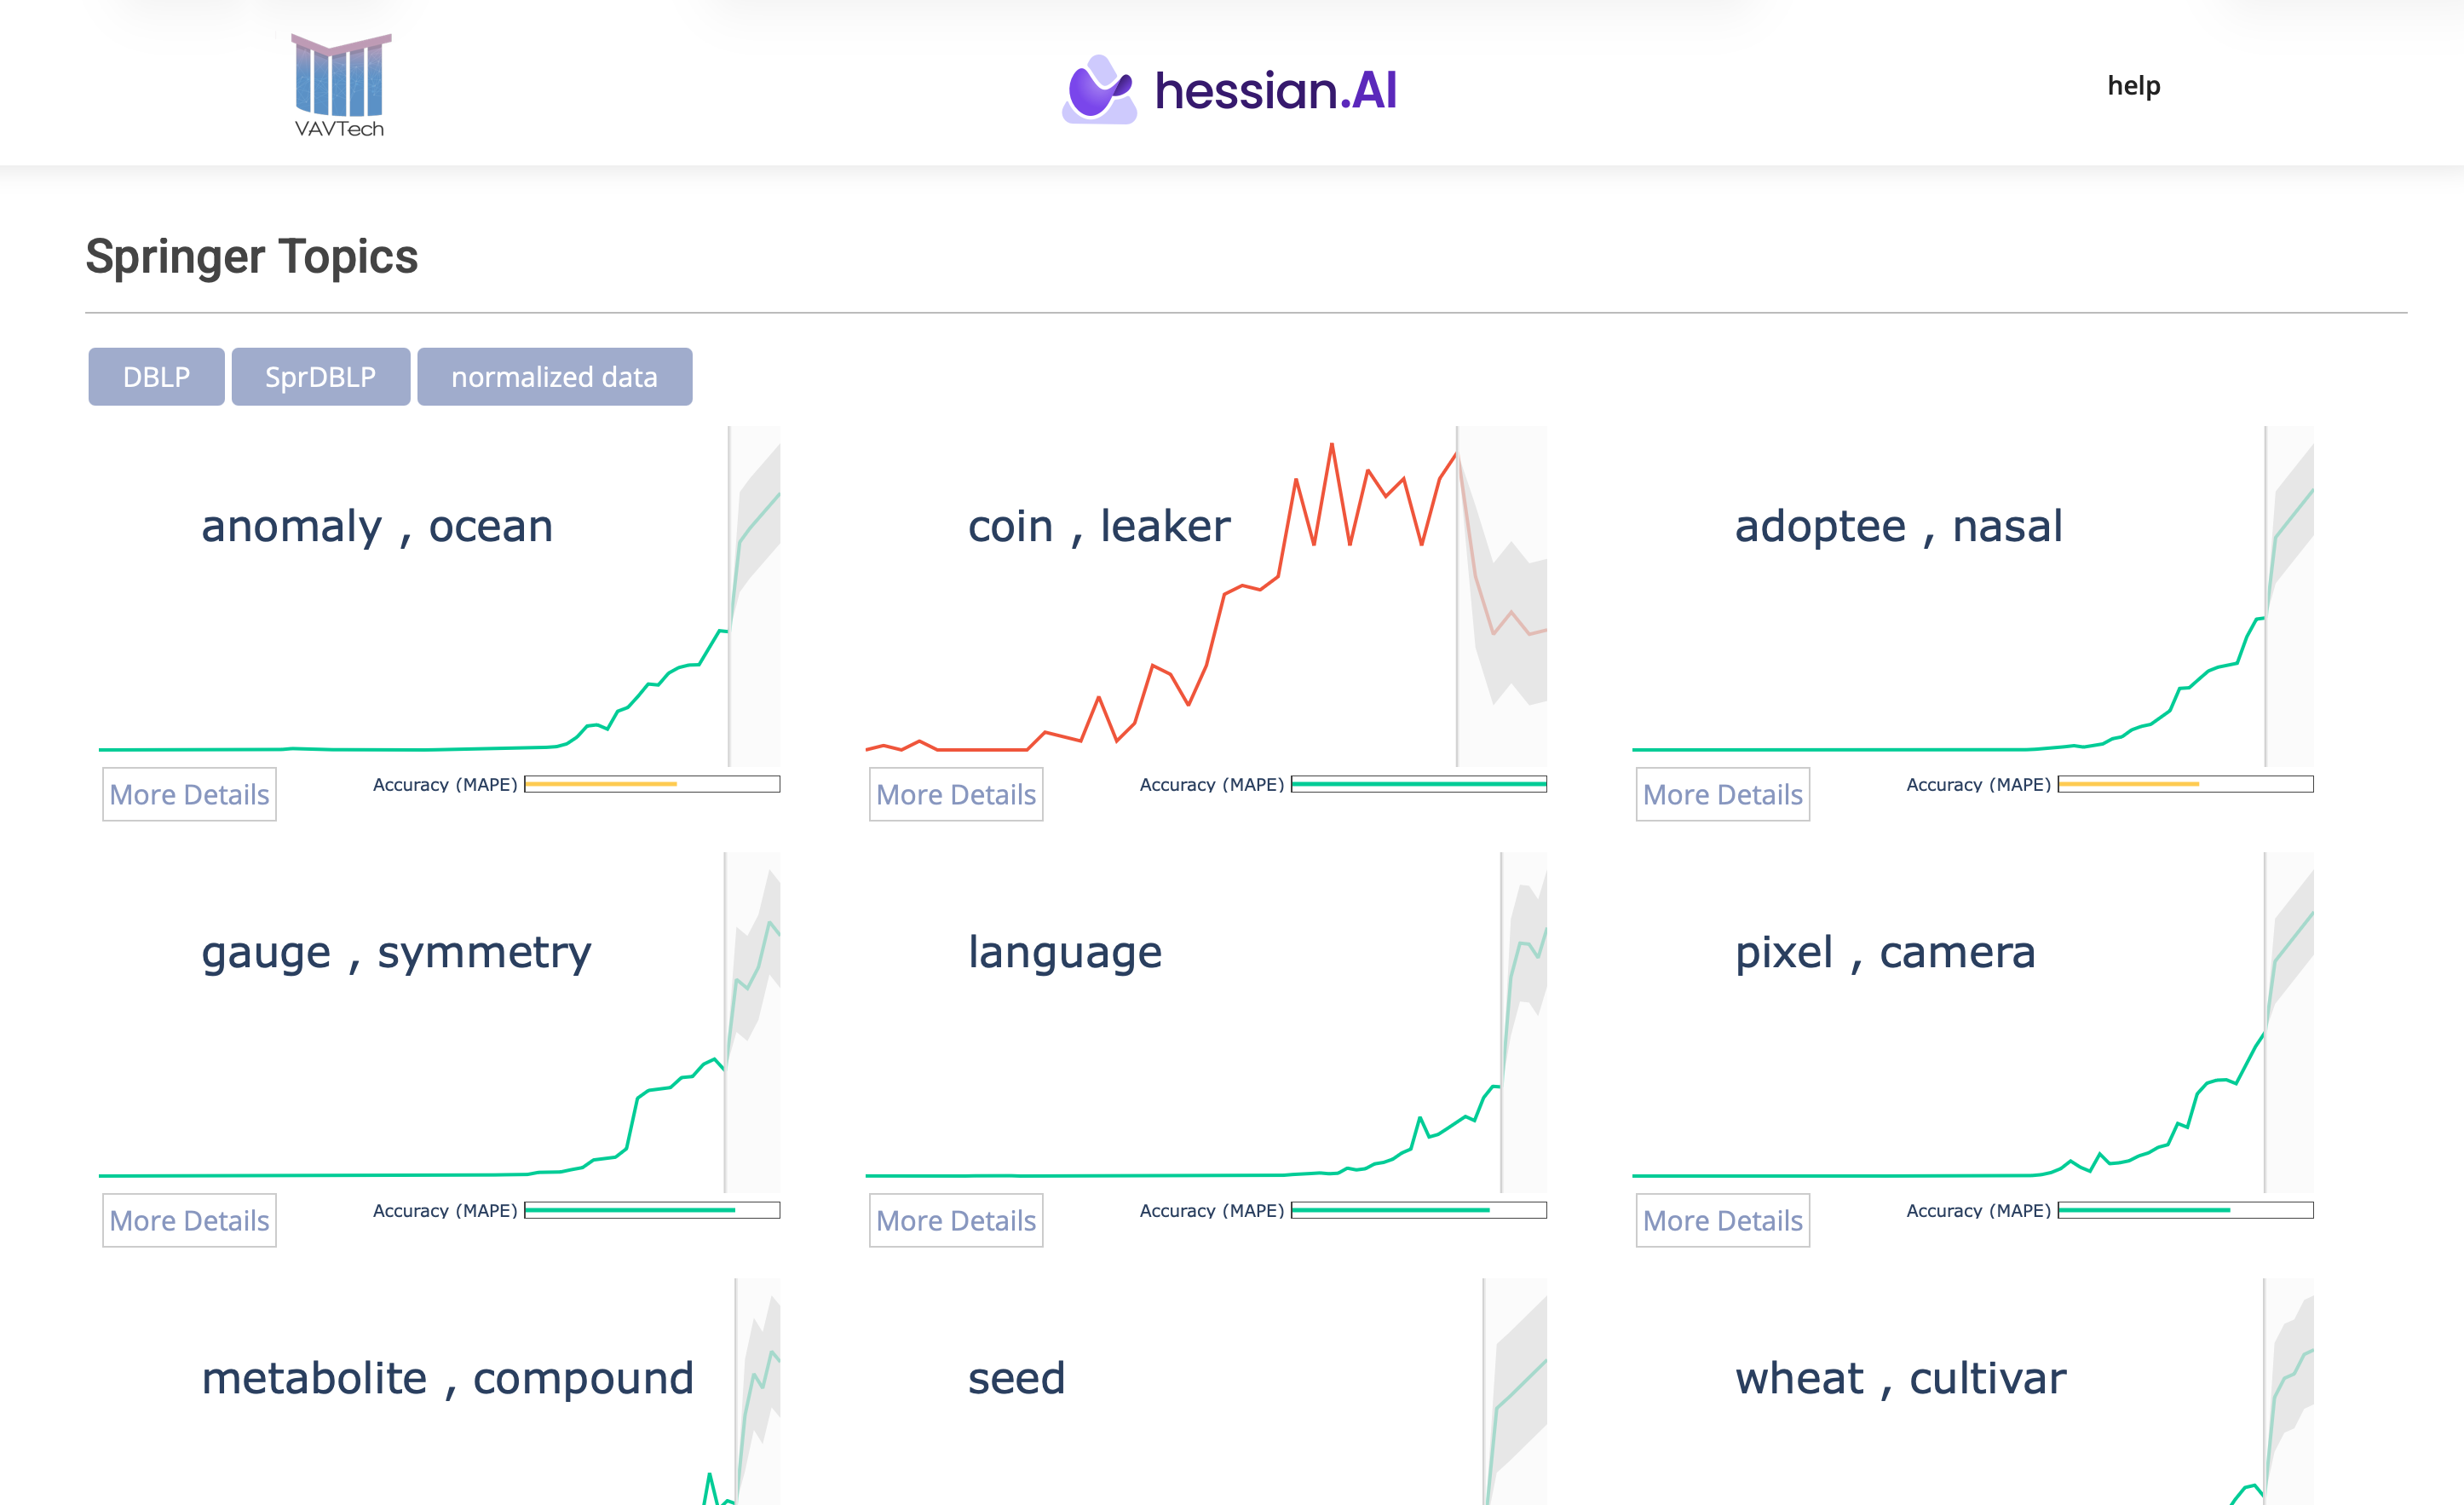
VAVTech Trend Dashboard
Trend Dashboard using DBLP and Springer publication Data. Data is forecasted from 2022 to 2027.
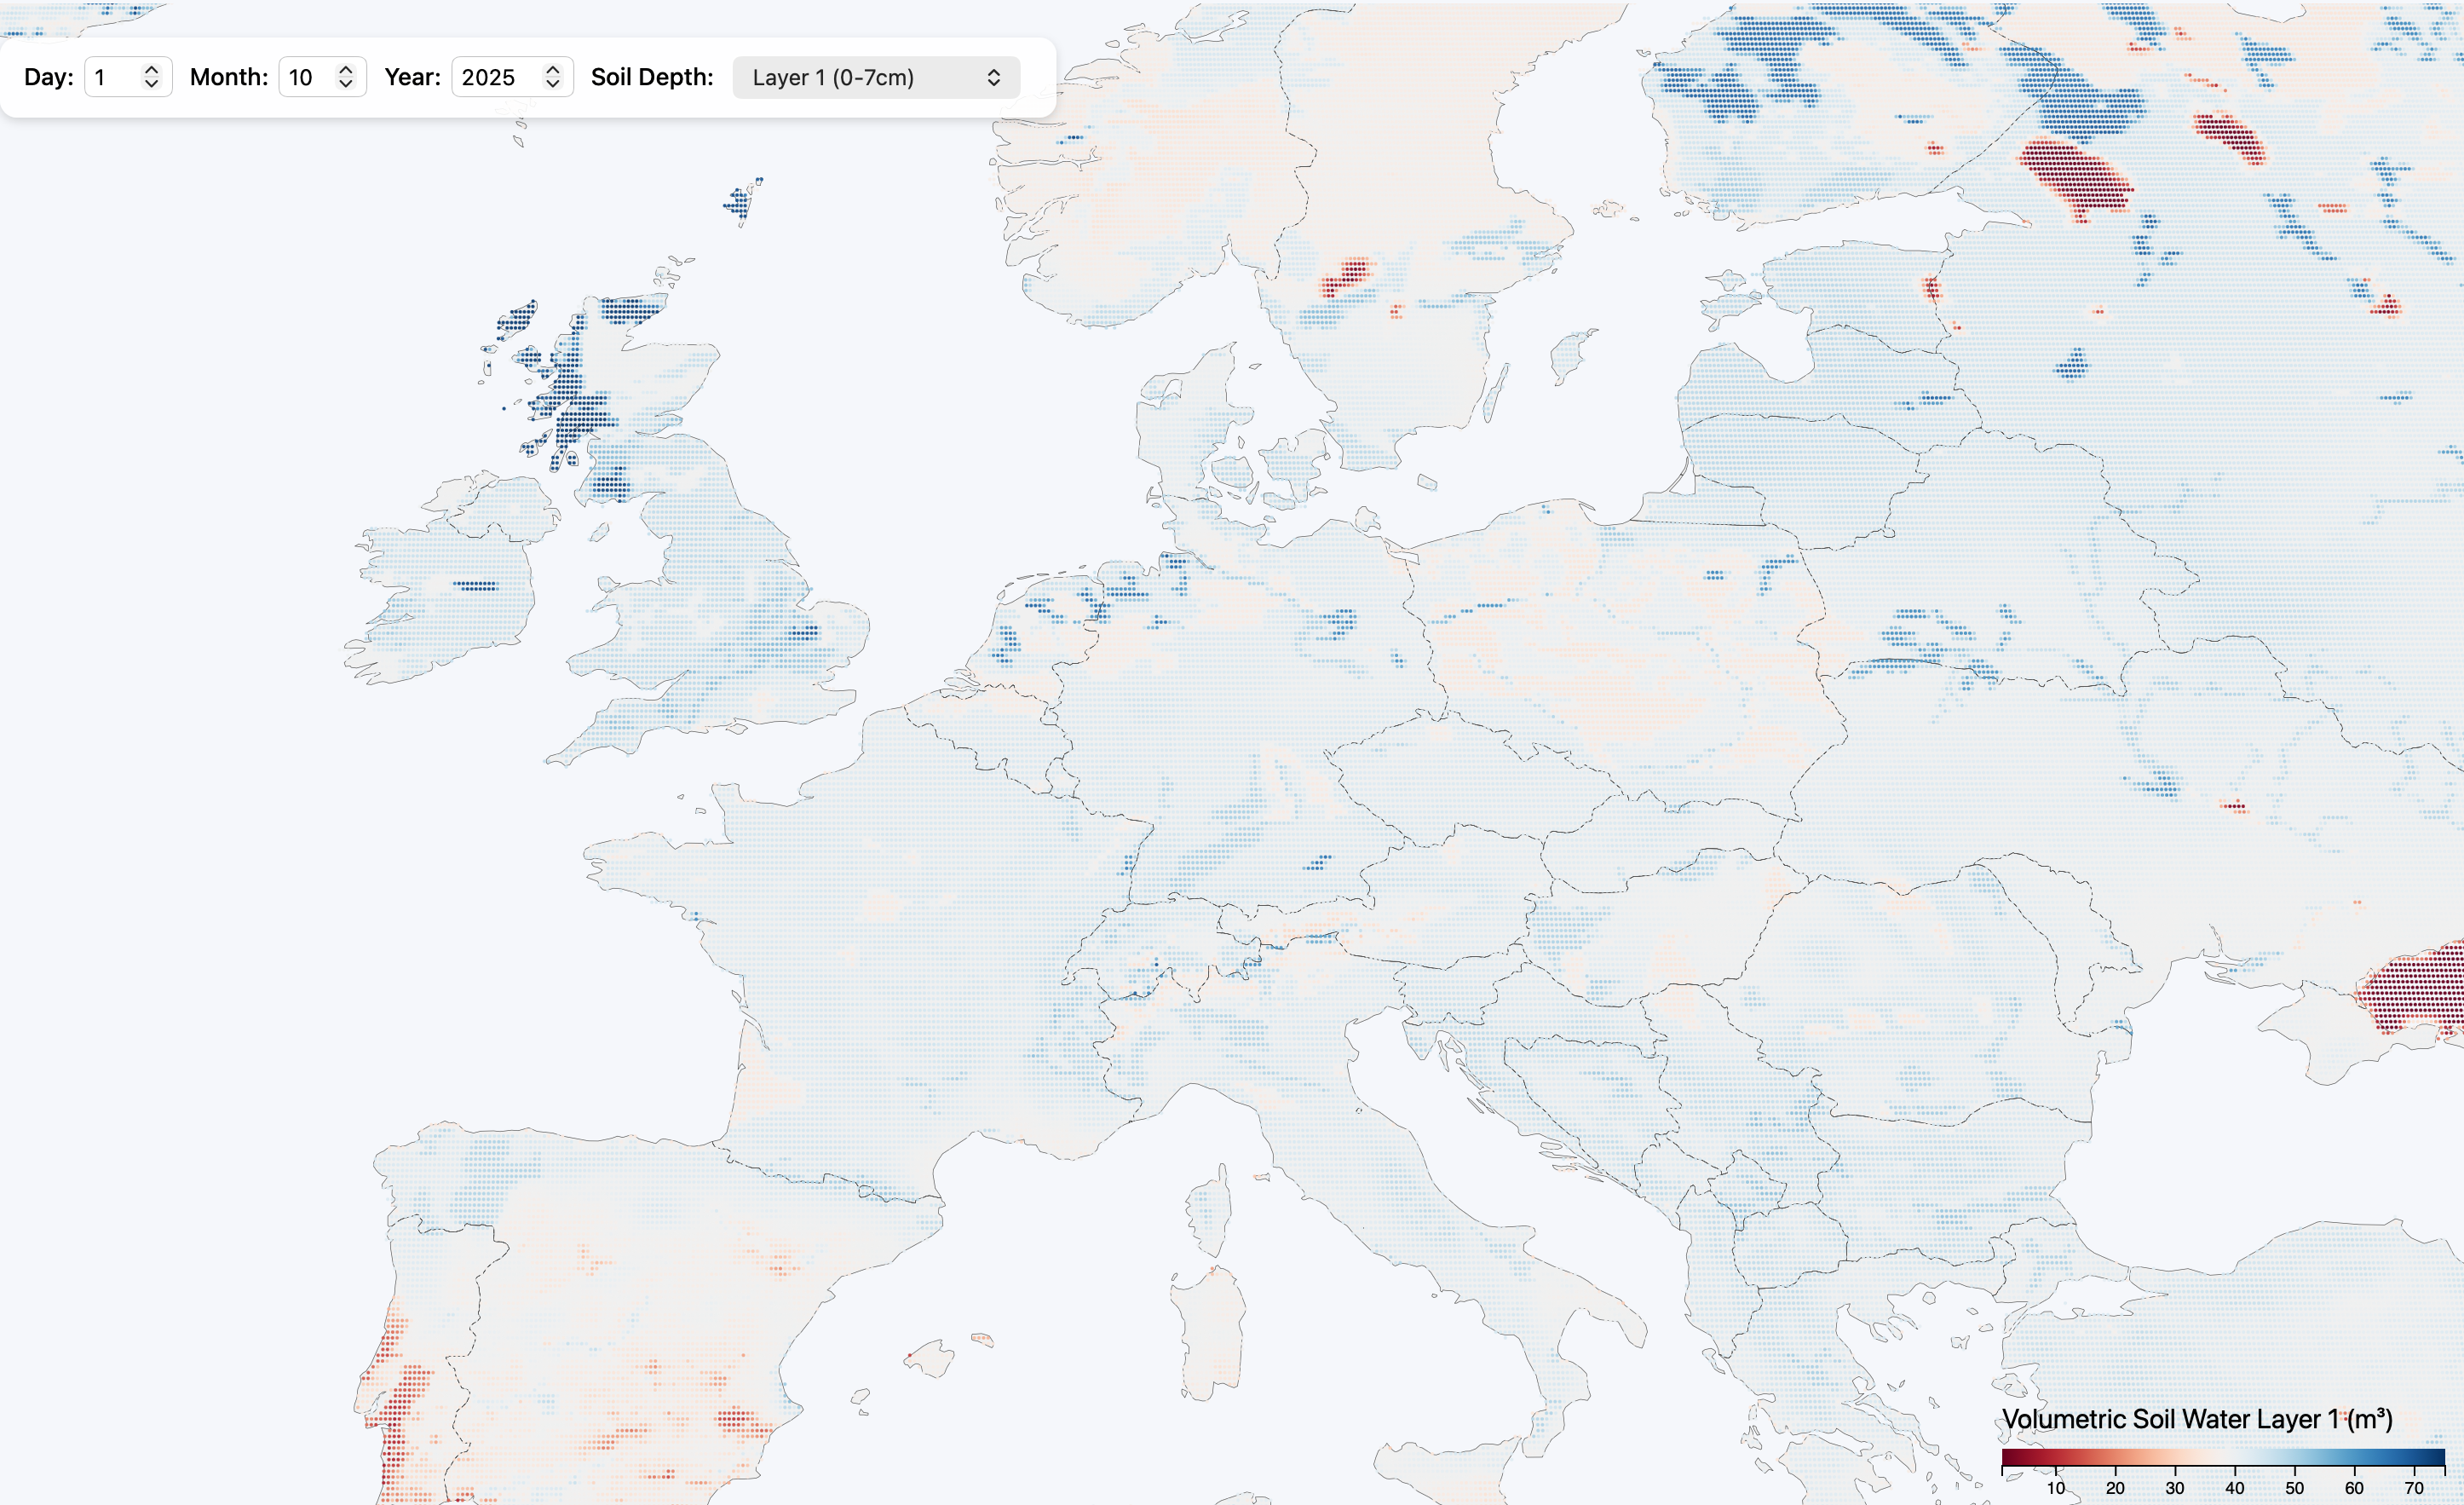
EU Map - Volumetric Soil Water
EU Map - Volumetric Soil Water, Raster/Grid Visualization, Copernicus API data.
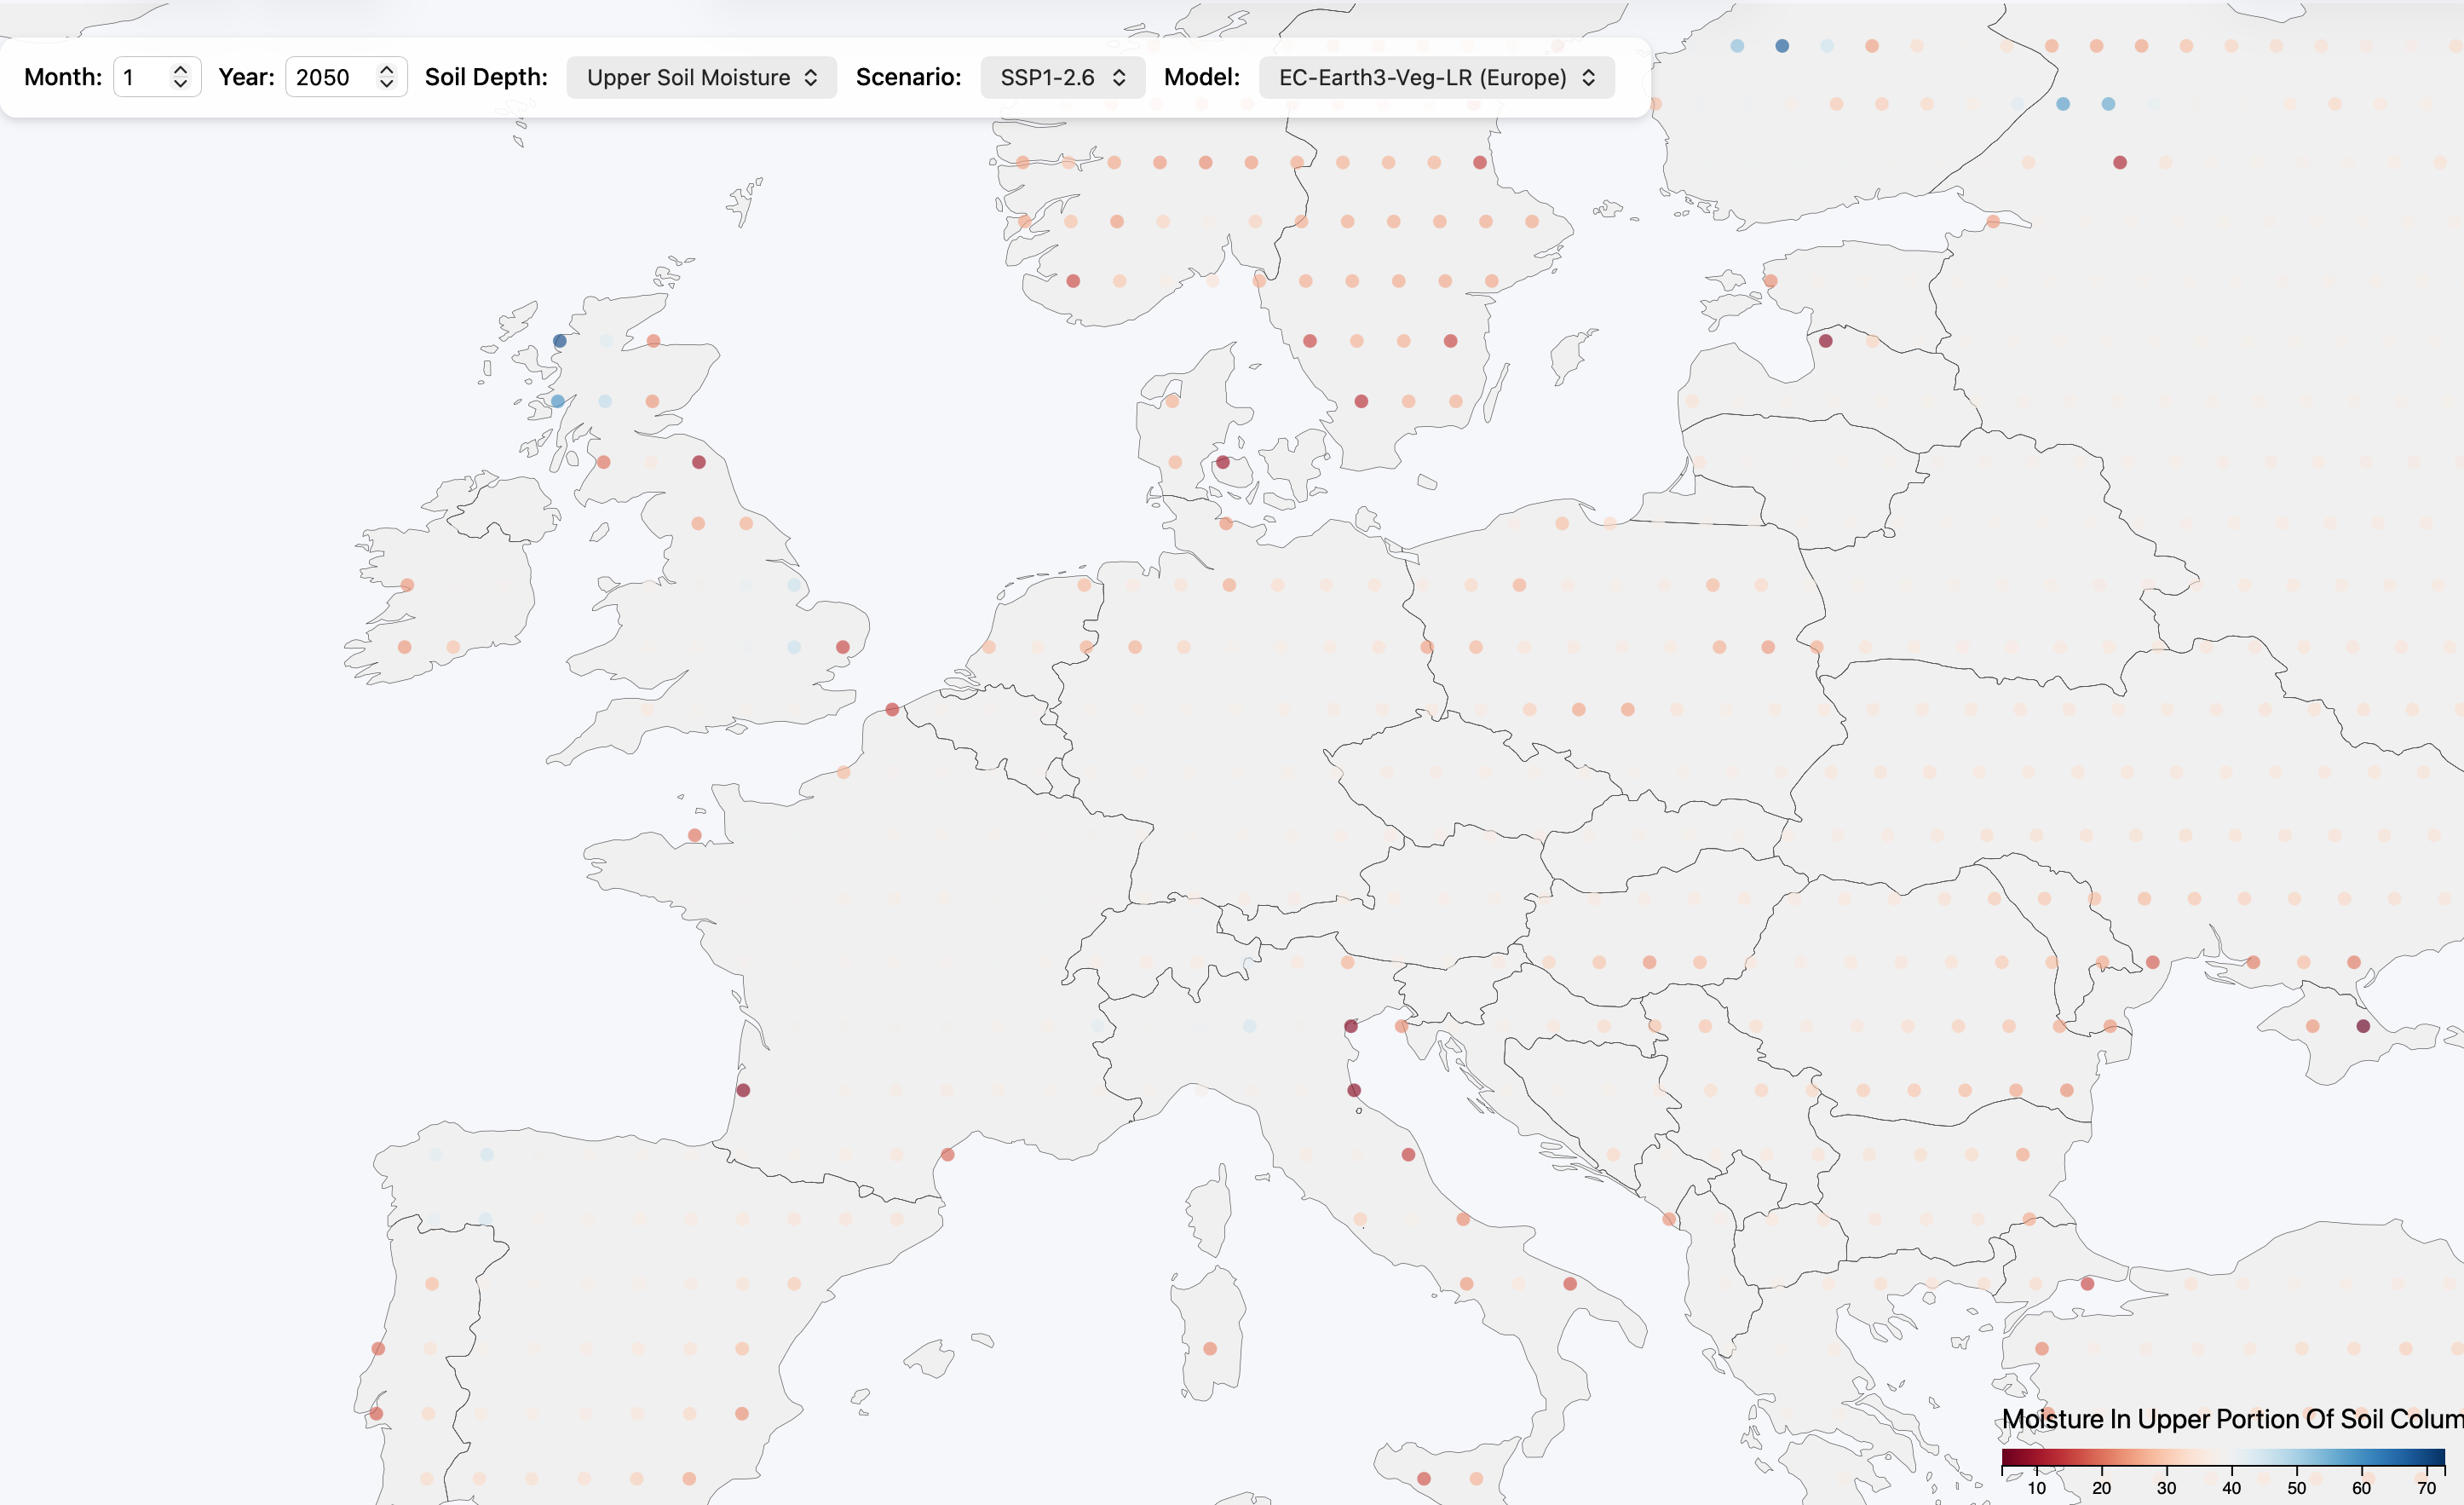
EU Map - SSP
EU Map - SSP, Raster/Grid Visualization, Copernicus API data.
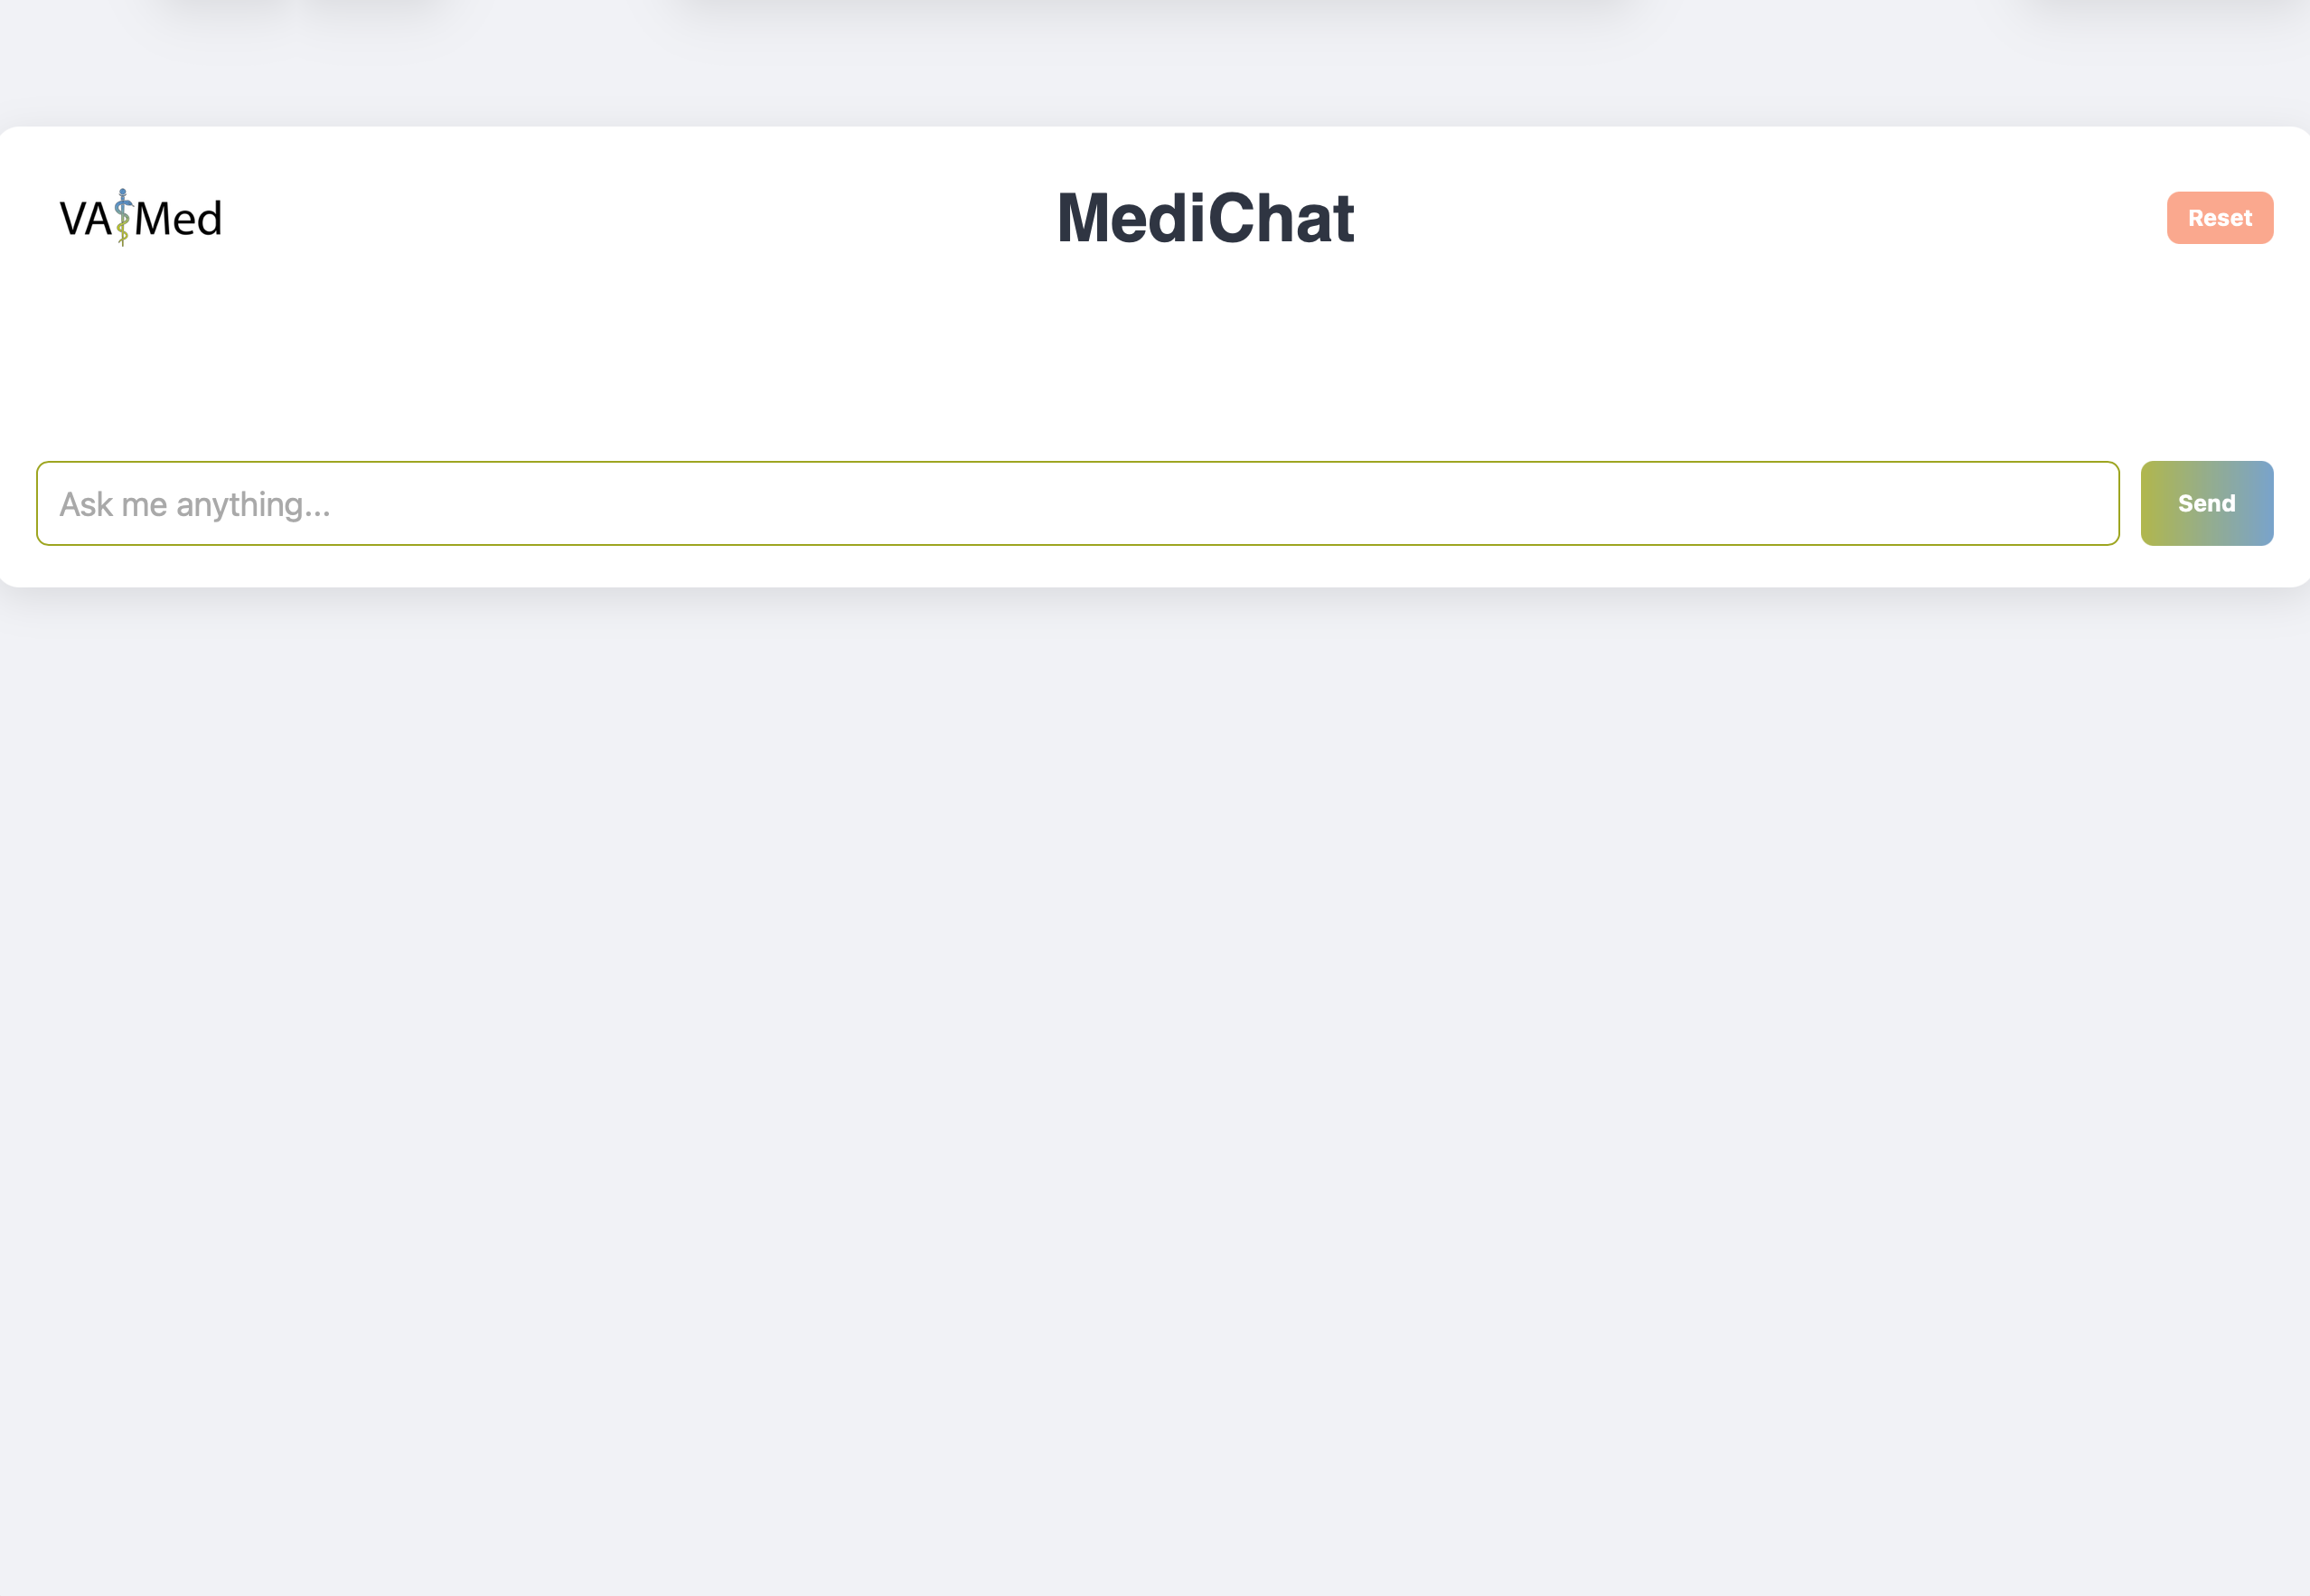
MediChat
Chatbot for Medical purpose.
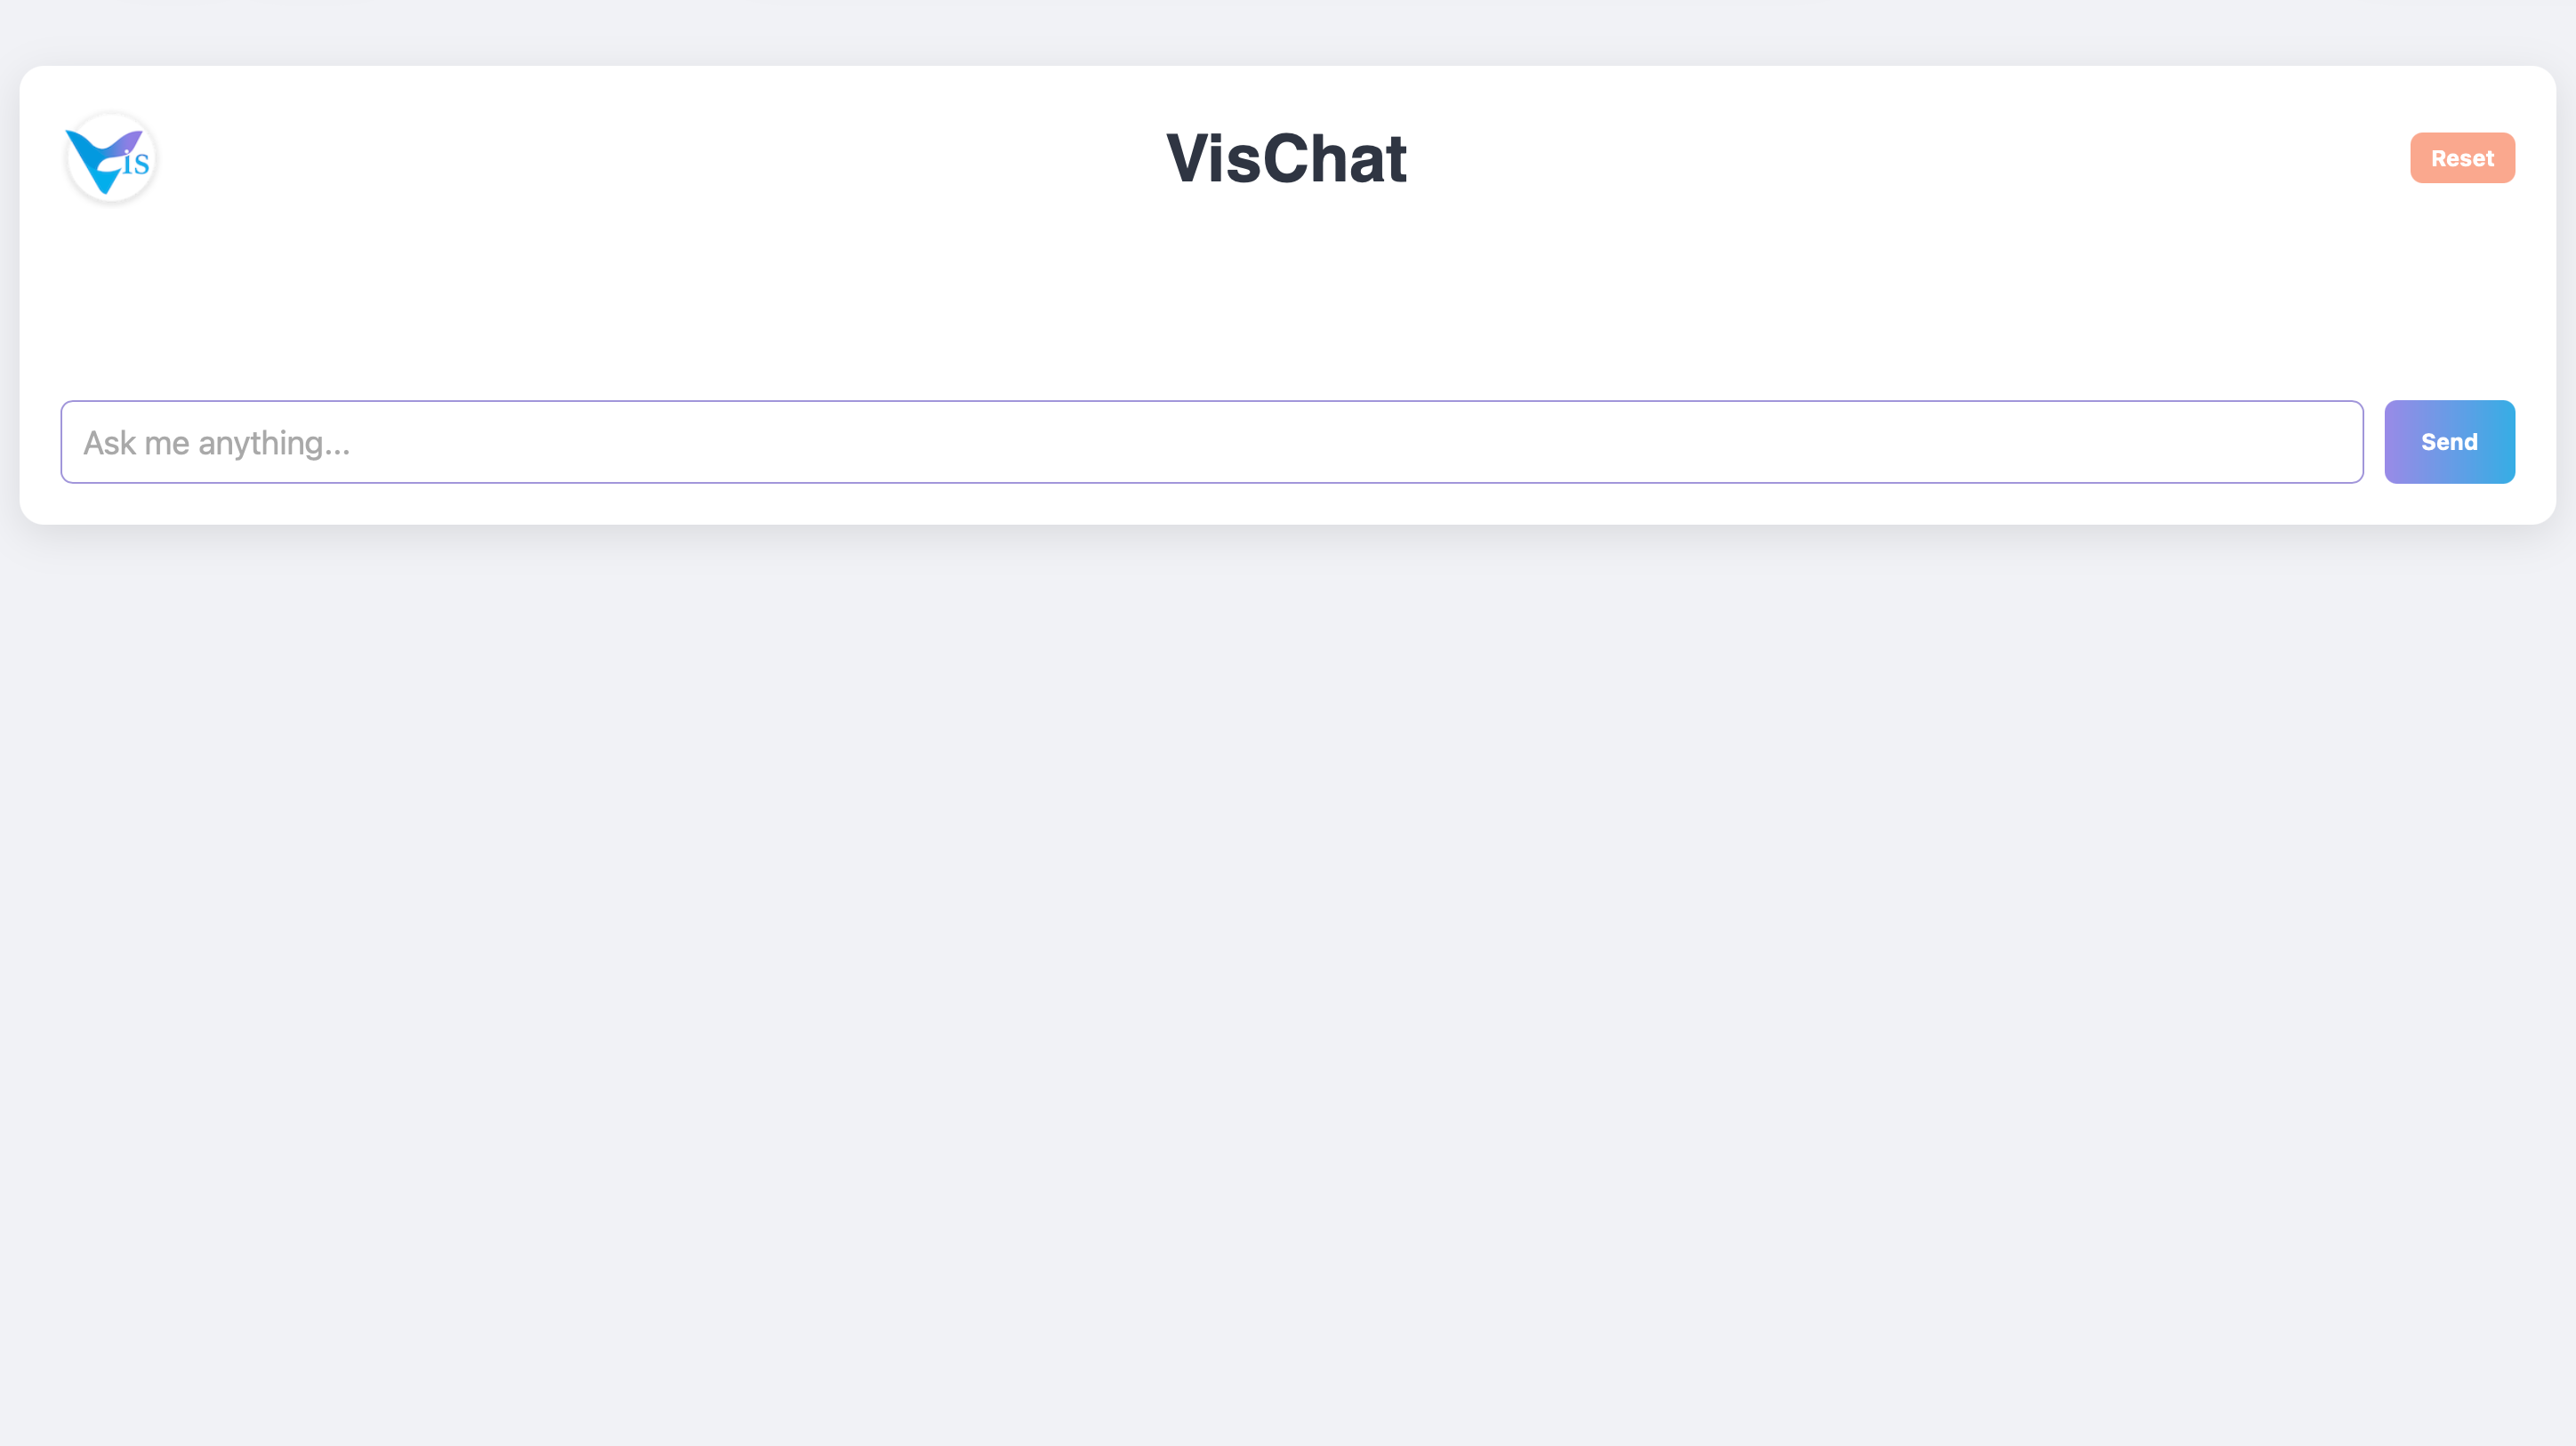
VisChat
Chatbot, VIS made.
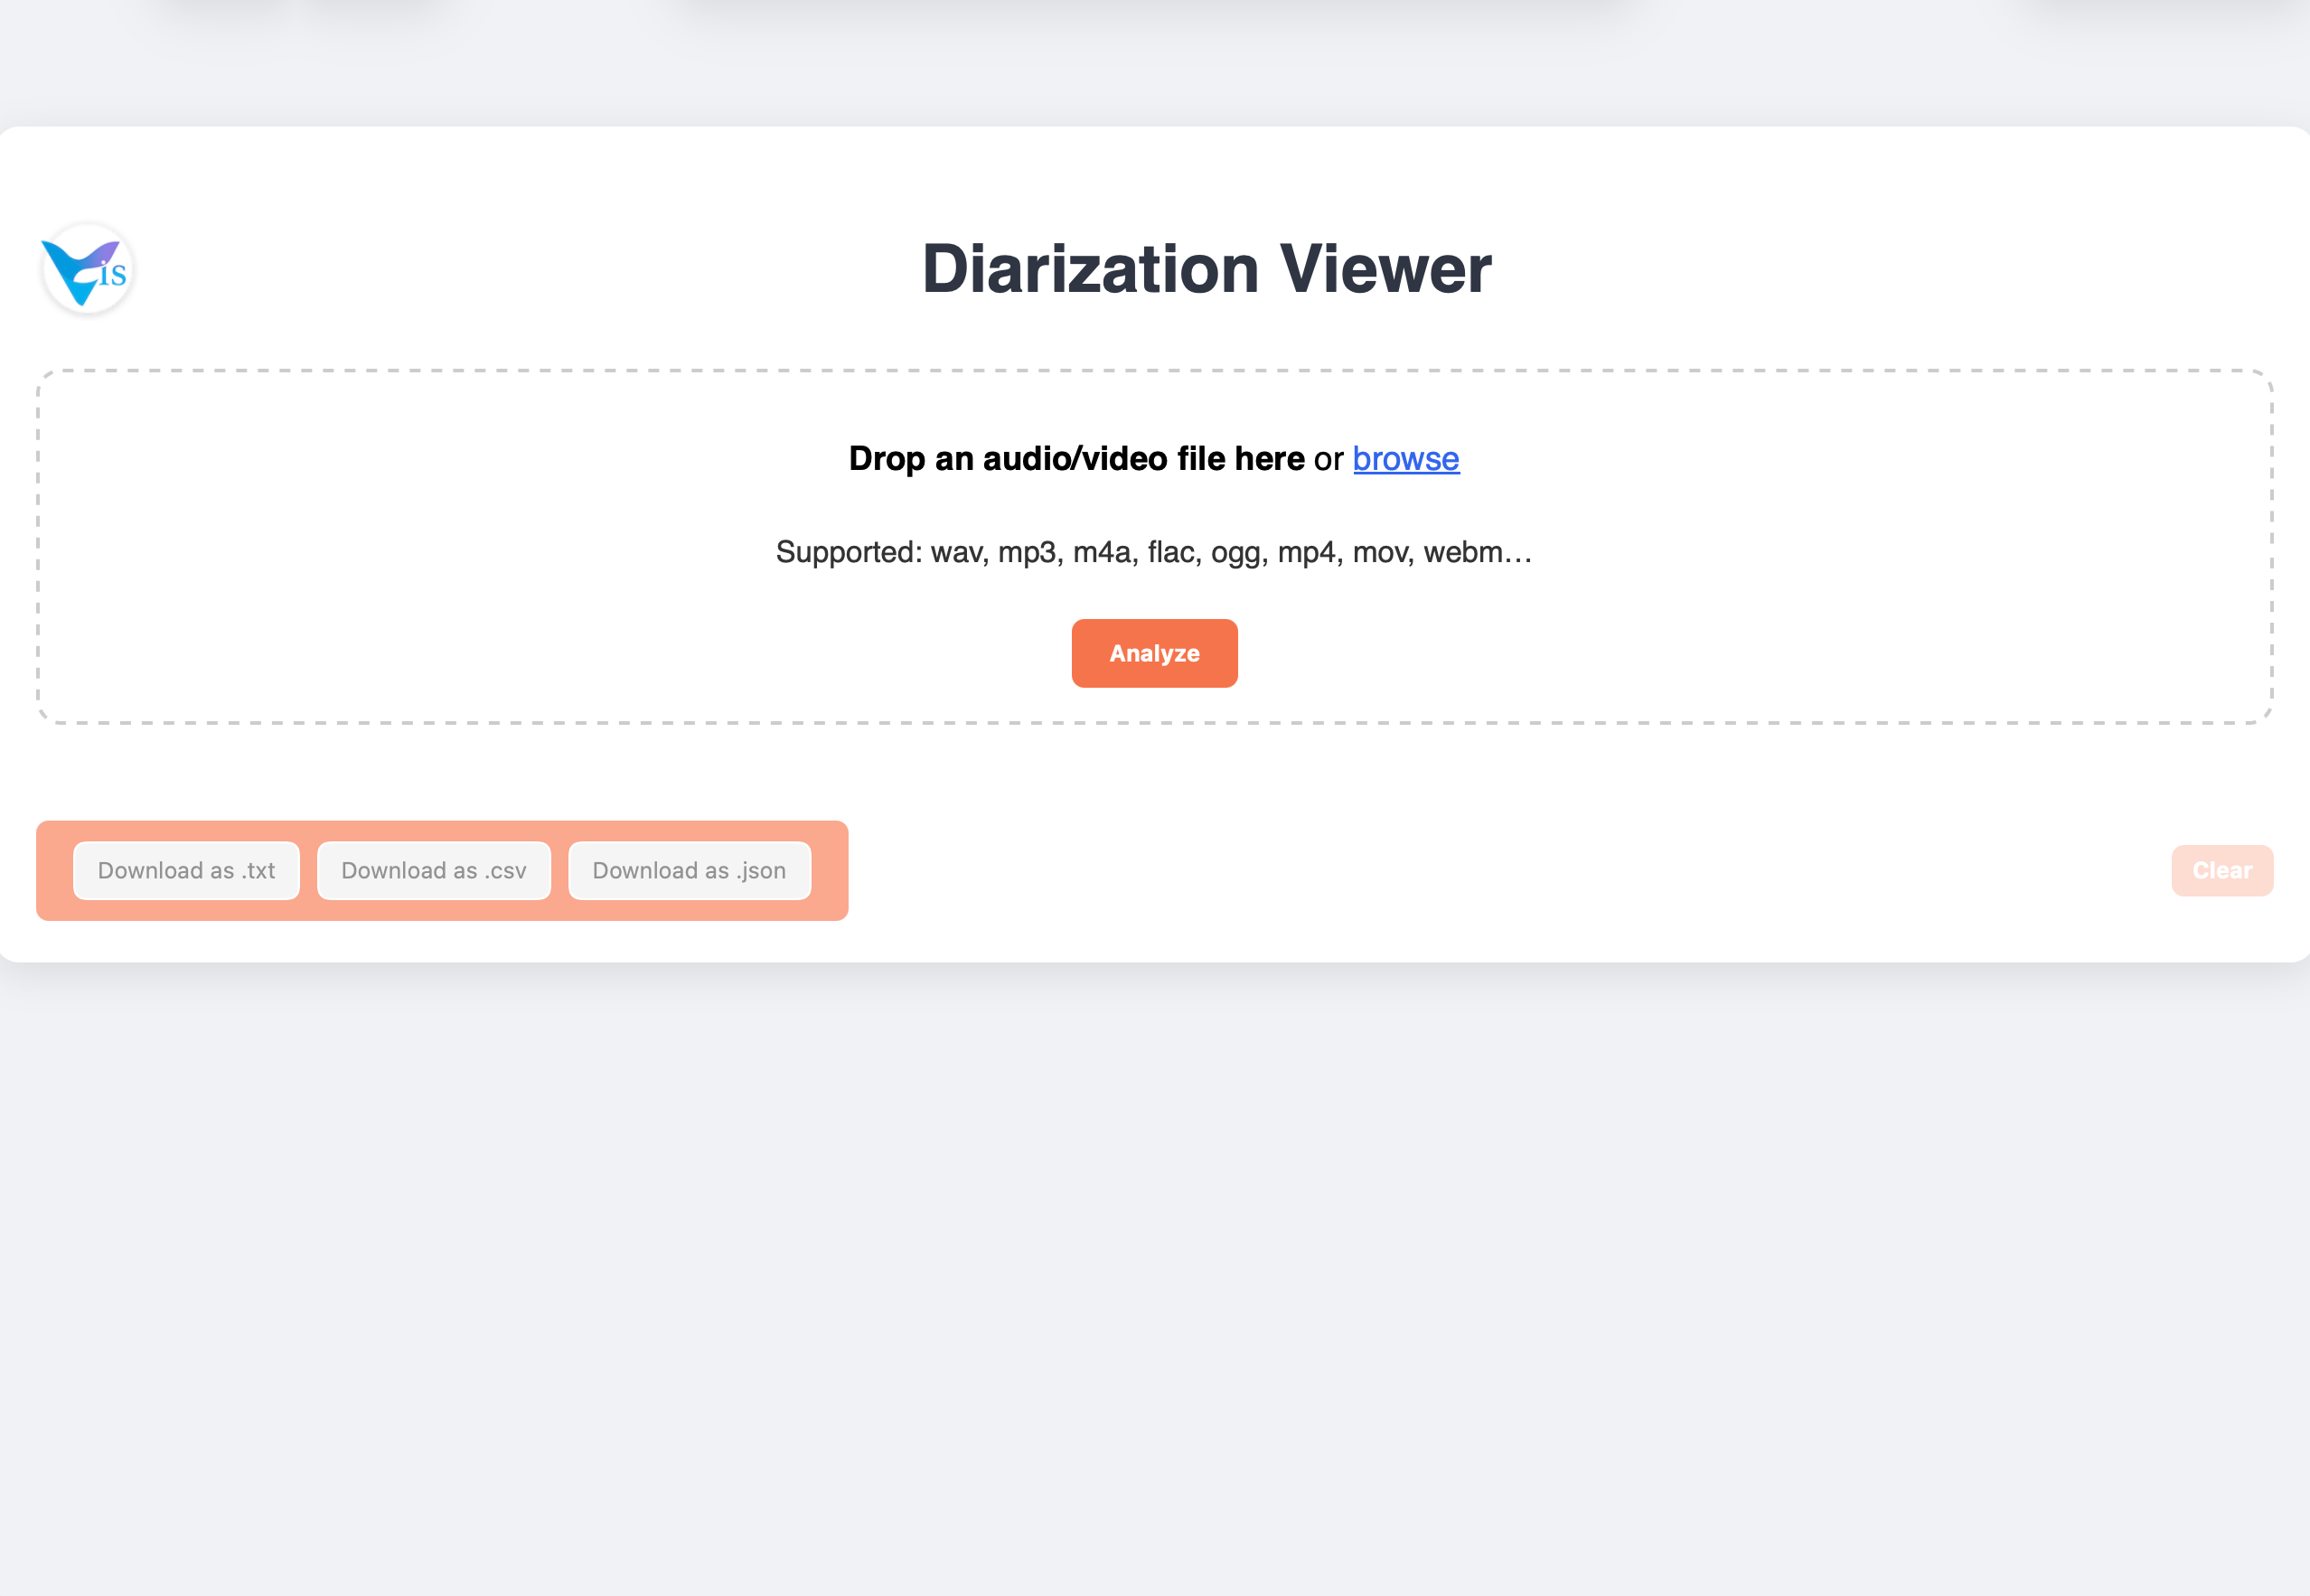
Diarization Viewer
Diarization Tool for speaker detection.
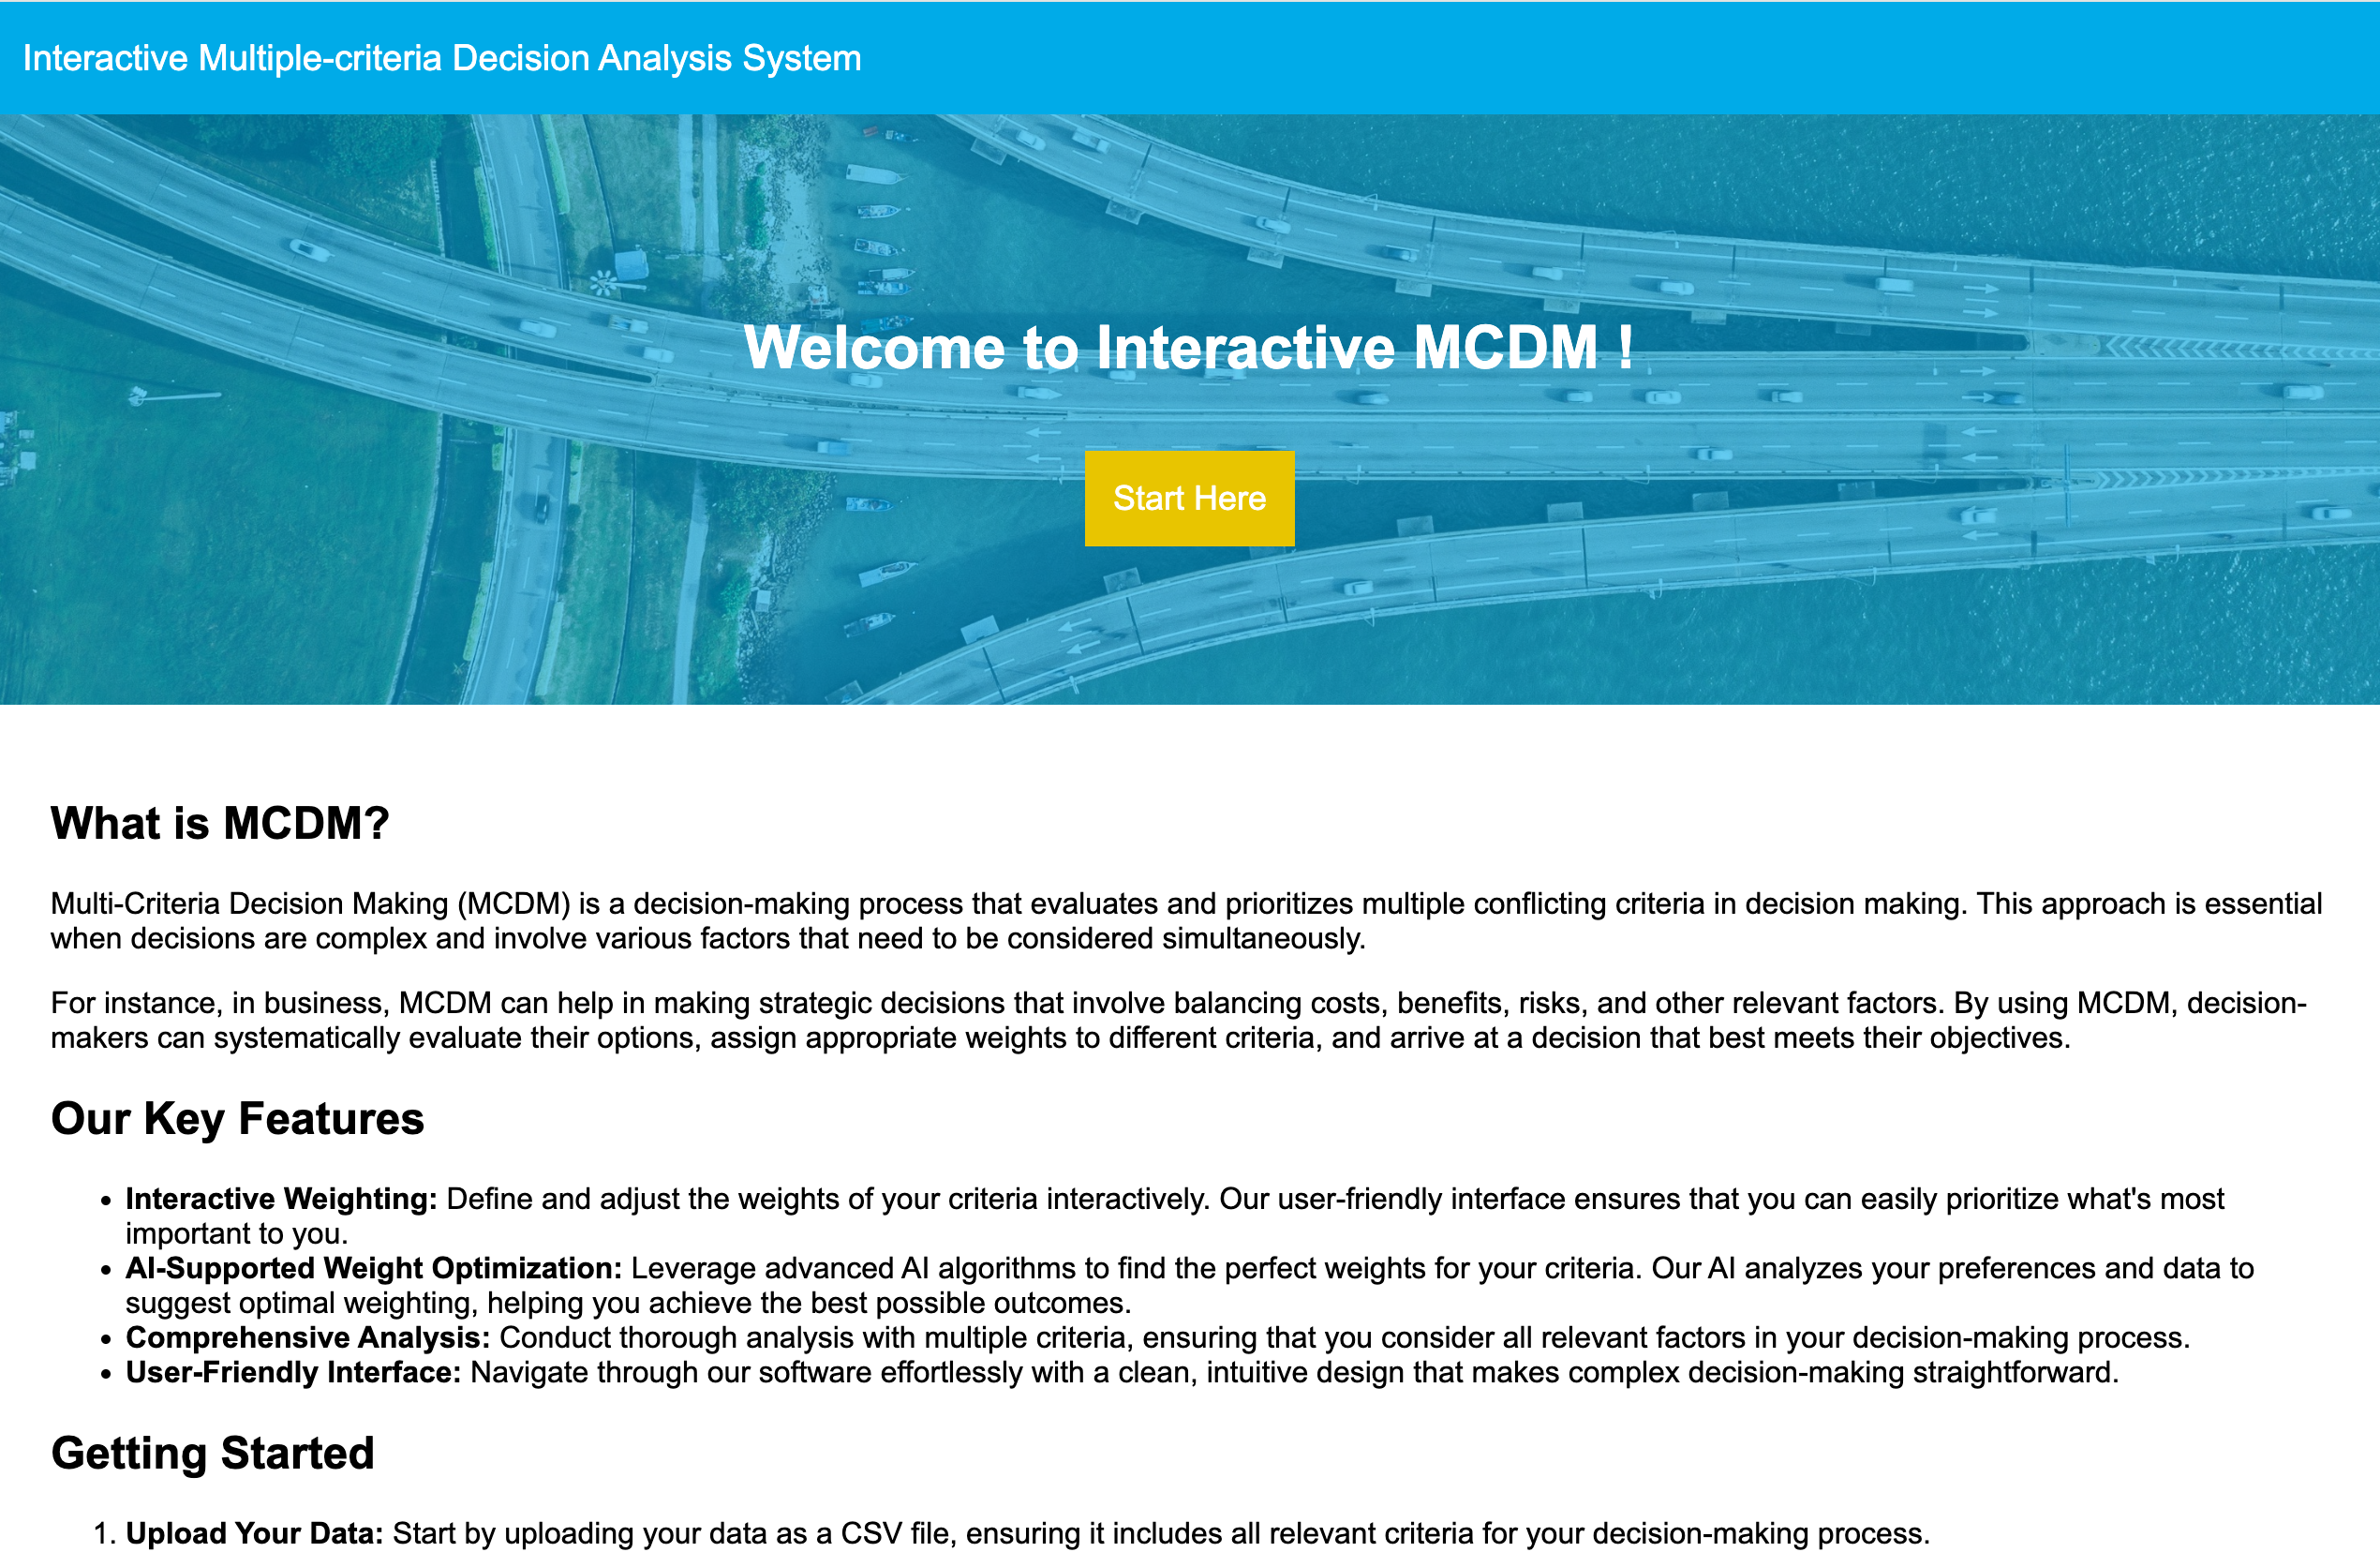
Interactive Multiple-criteria Decision Analysis System
Multi-Criteria Decision Making (MCDM) is a decision-making process that evaluates and prioritizes multiple conflicting criteria in decision making. This approach is essential when decisions are complex and involve various factors that need to be considered simultaneously.
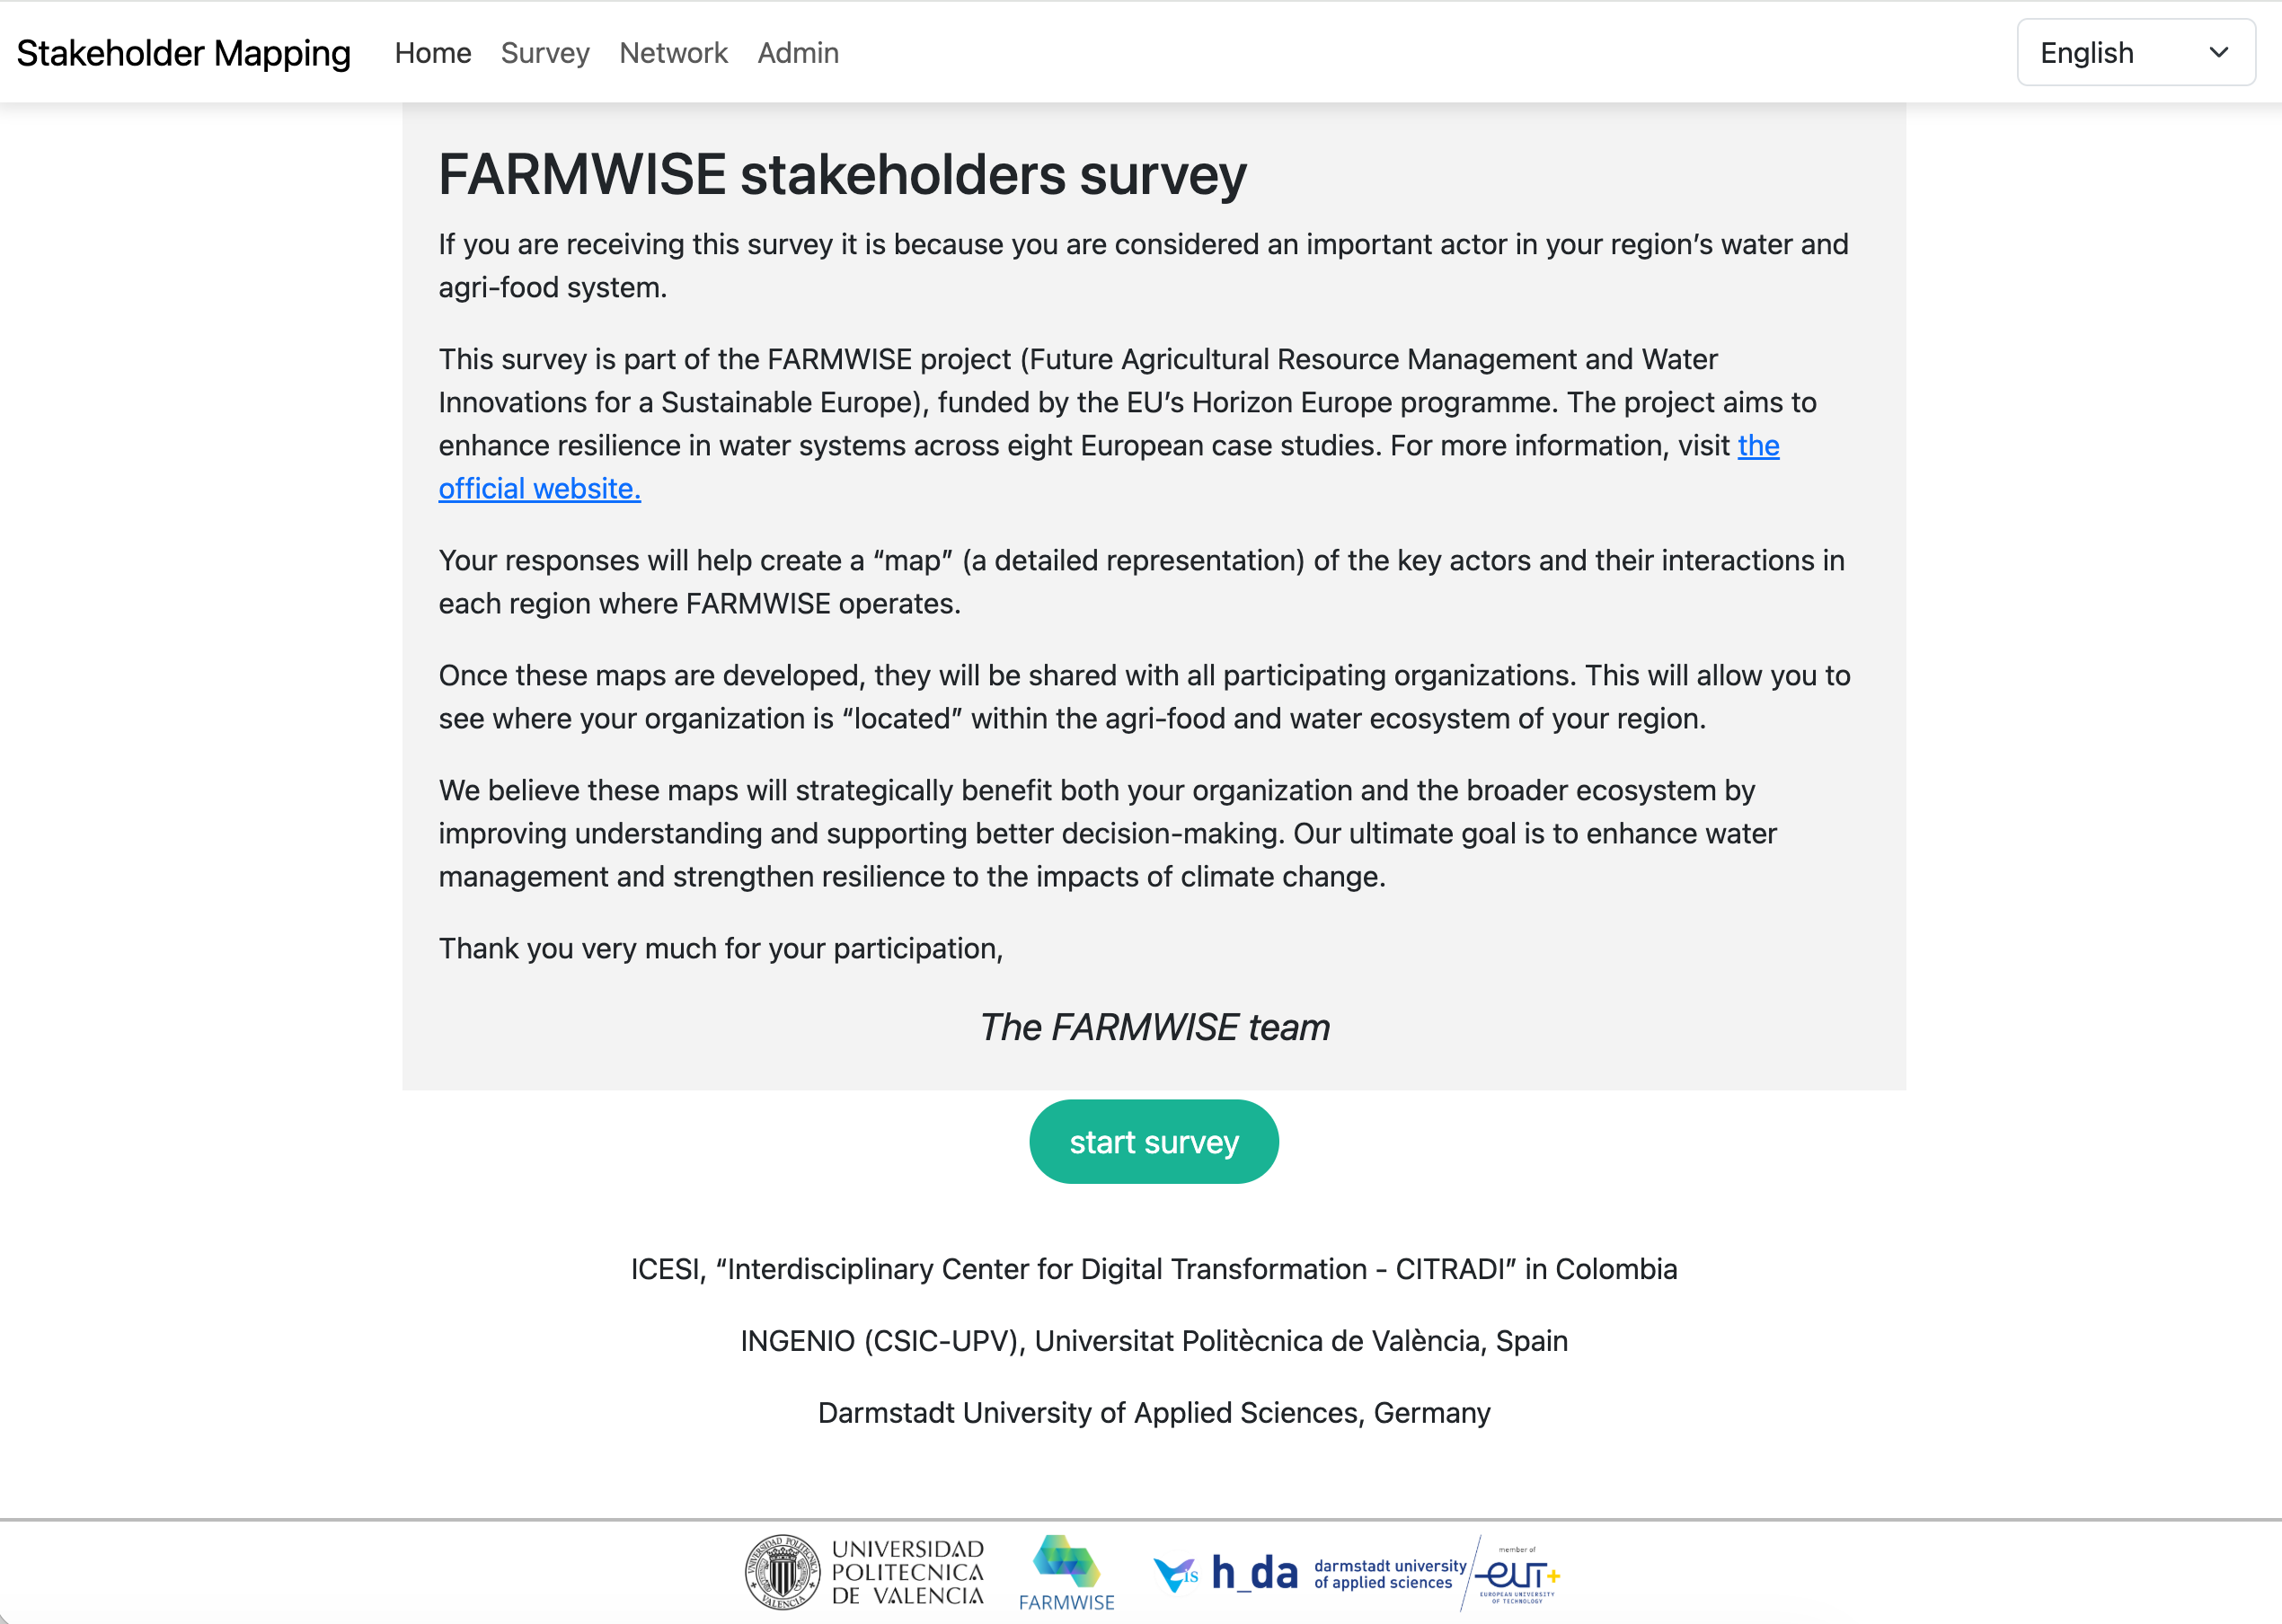
FARMWISE stakeholders survey
This survey is part of the FARMWISE project (Future Agricultural Resource Management and Water Innovations for a Sustainable Europe), funded by the EU’s Horizon Europe programme.
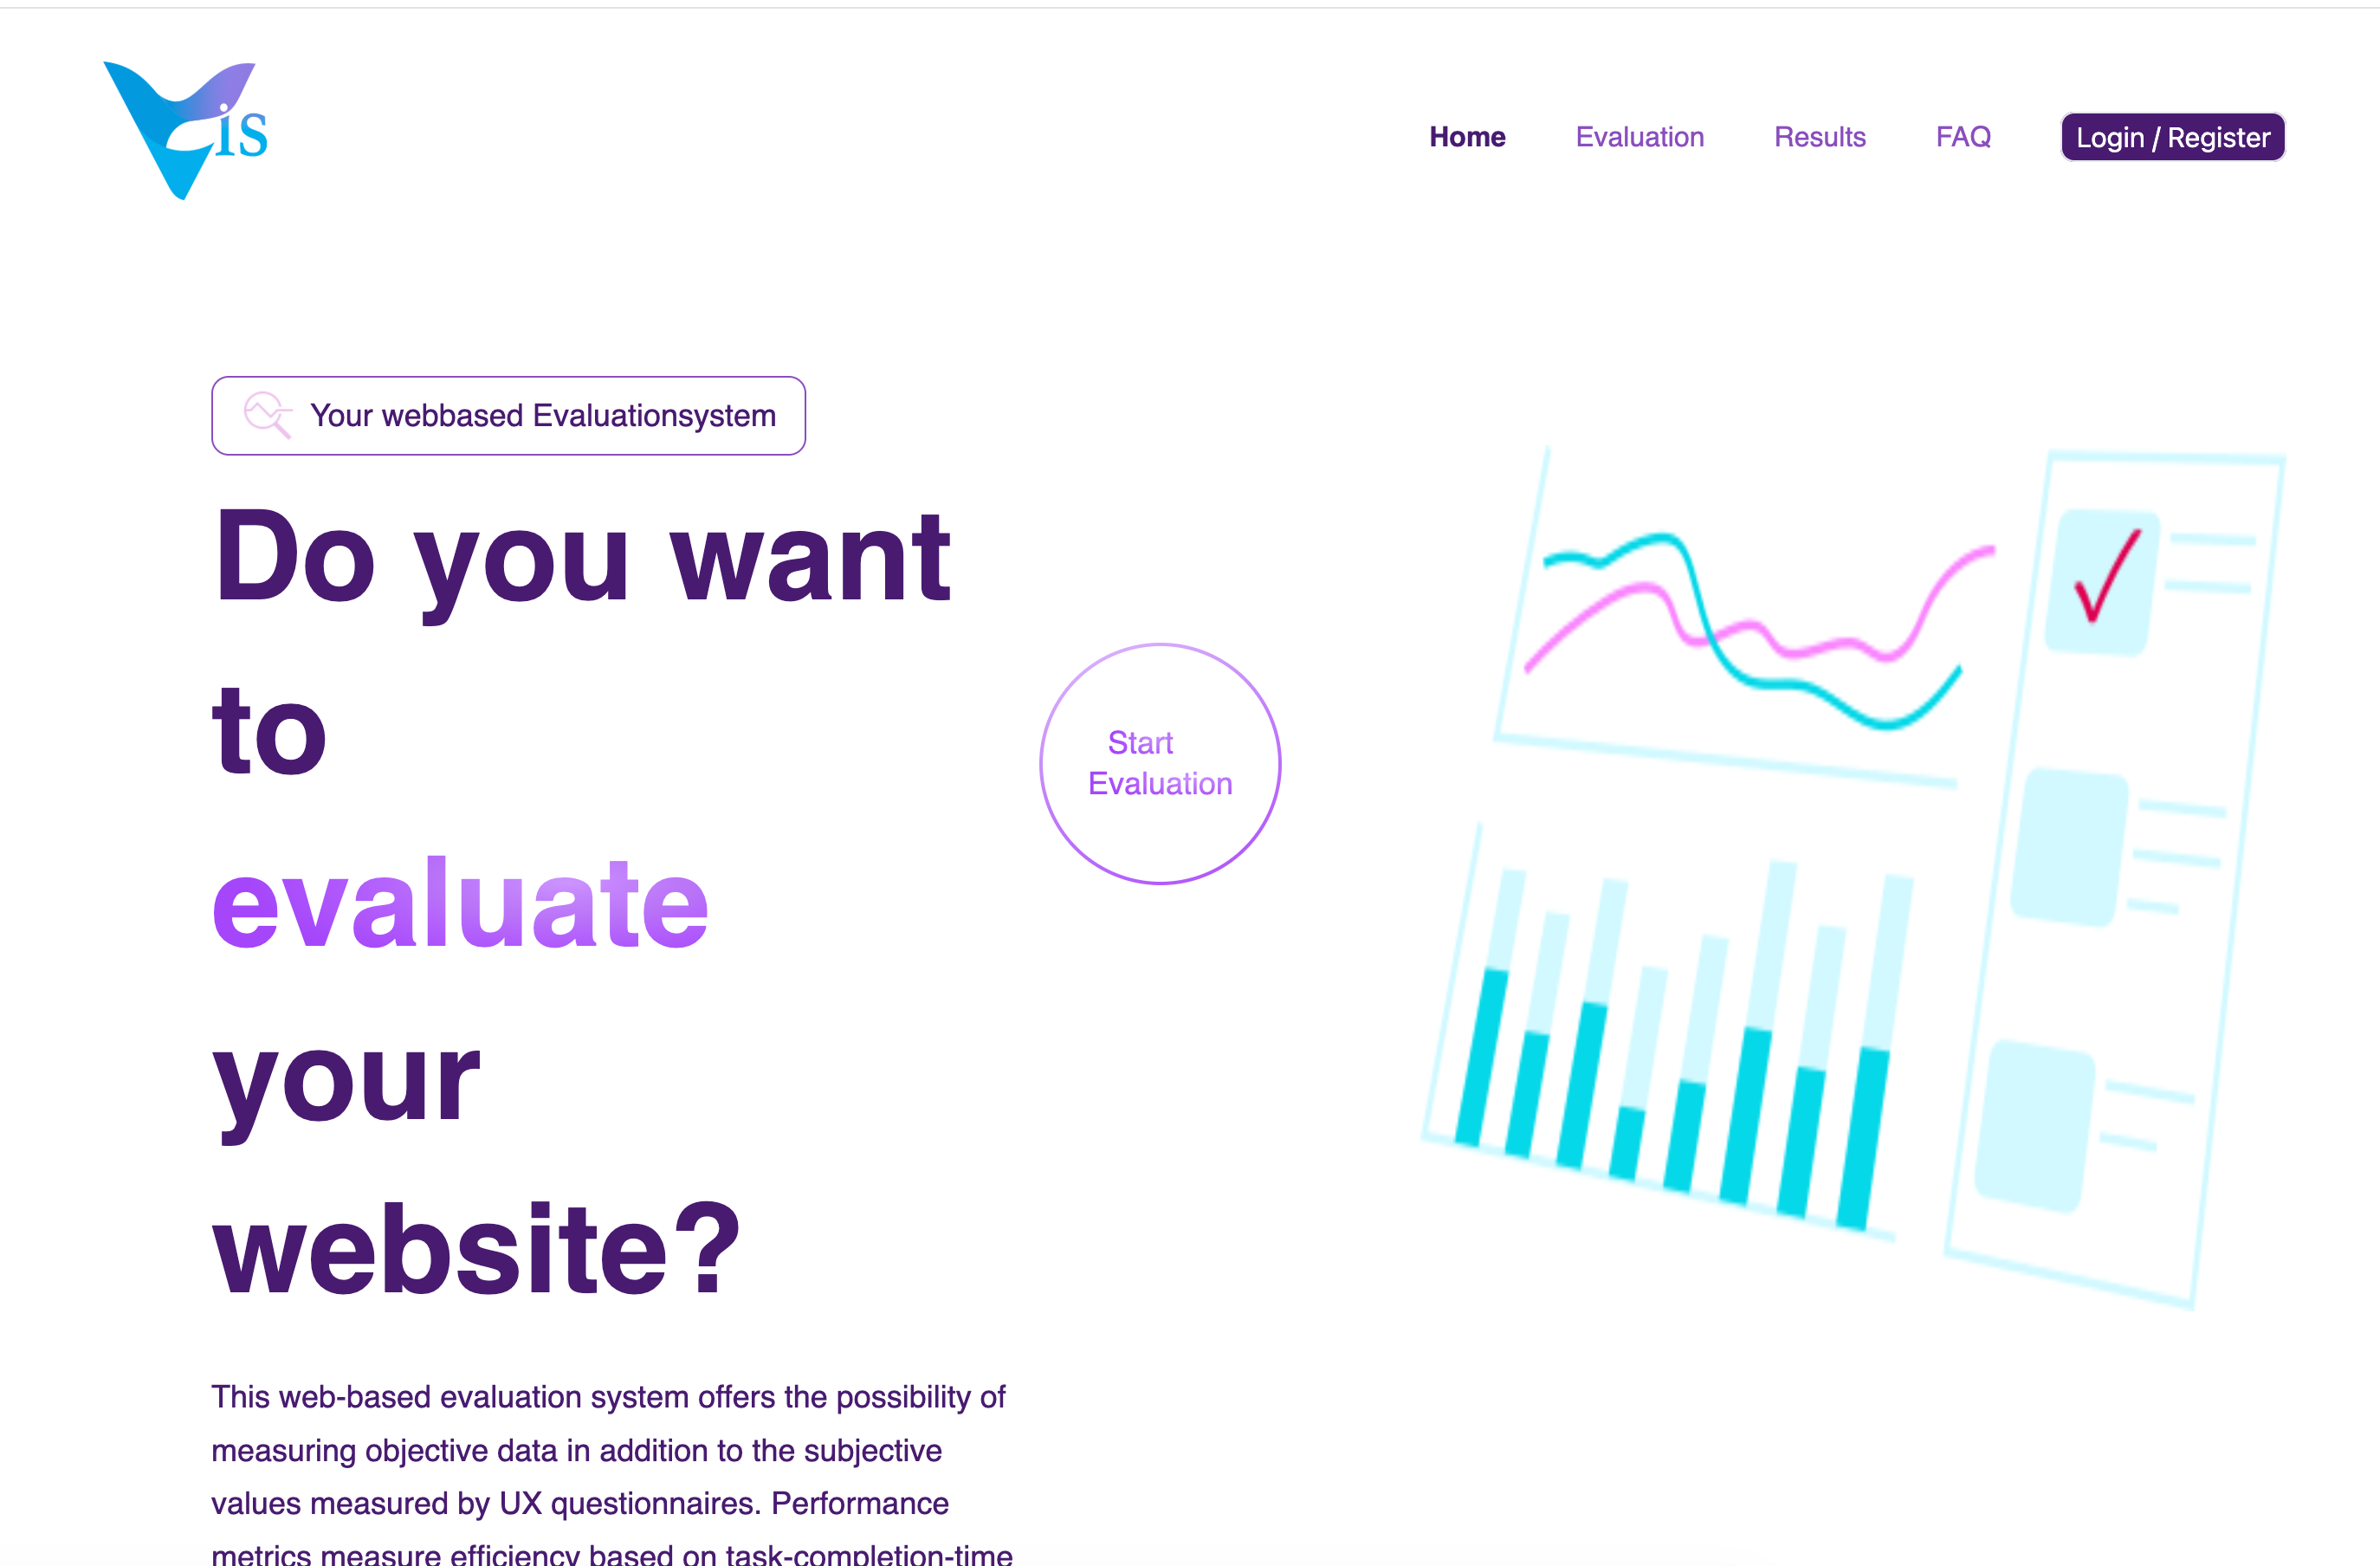
Webbased Evaluationsystem
This web-based evaluation system offers the possibility of measuring objective data in addition to the subjective values measured by UX questionnaires.
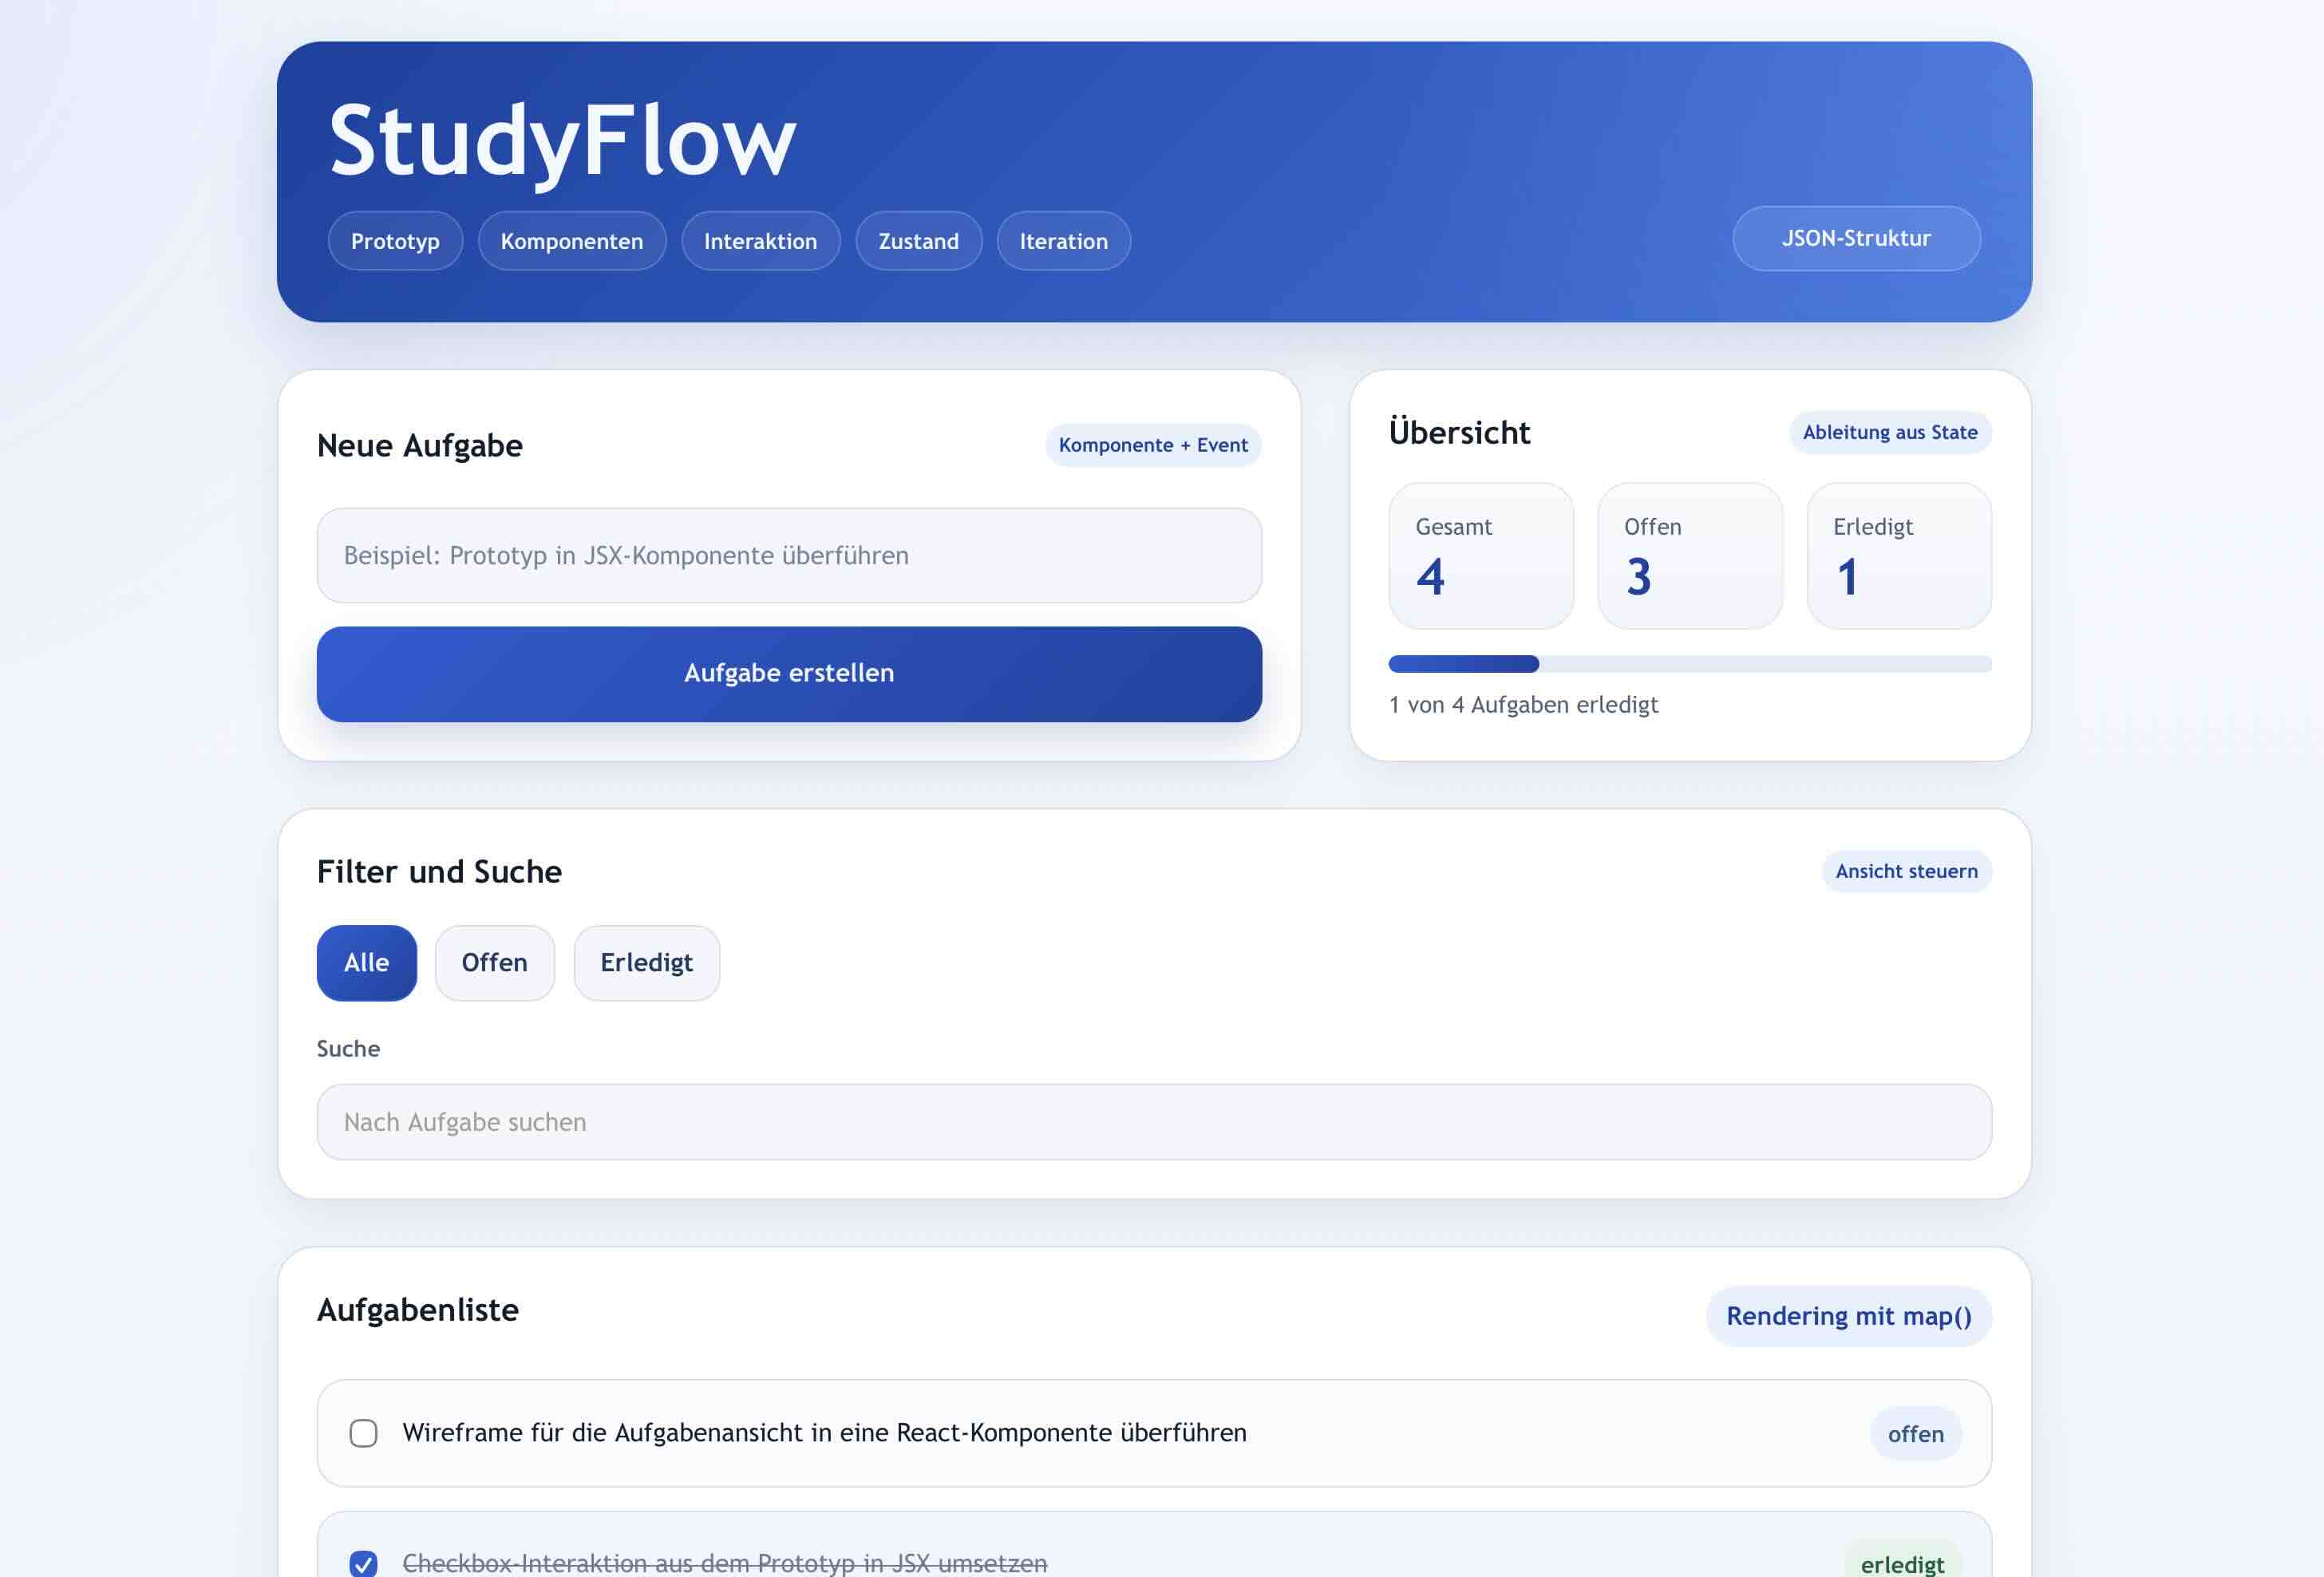
HCI Demo -Studyflow
This is a demonstrator for HCI based development with react.
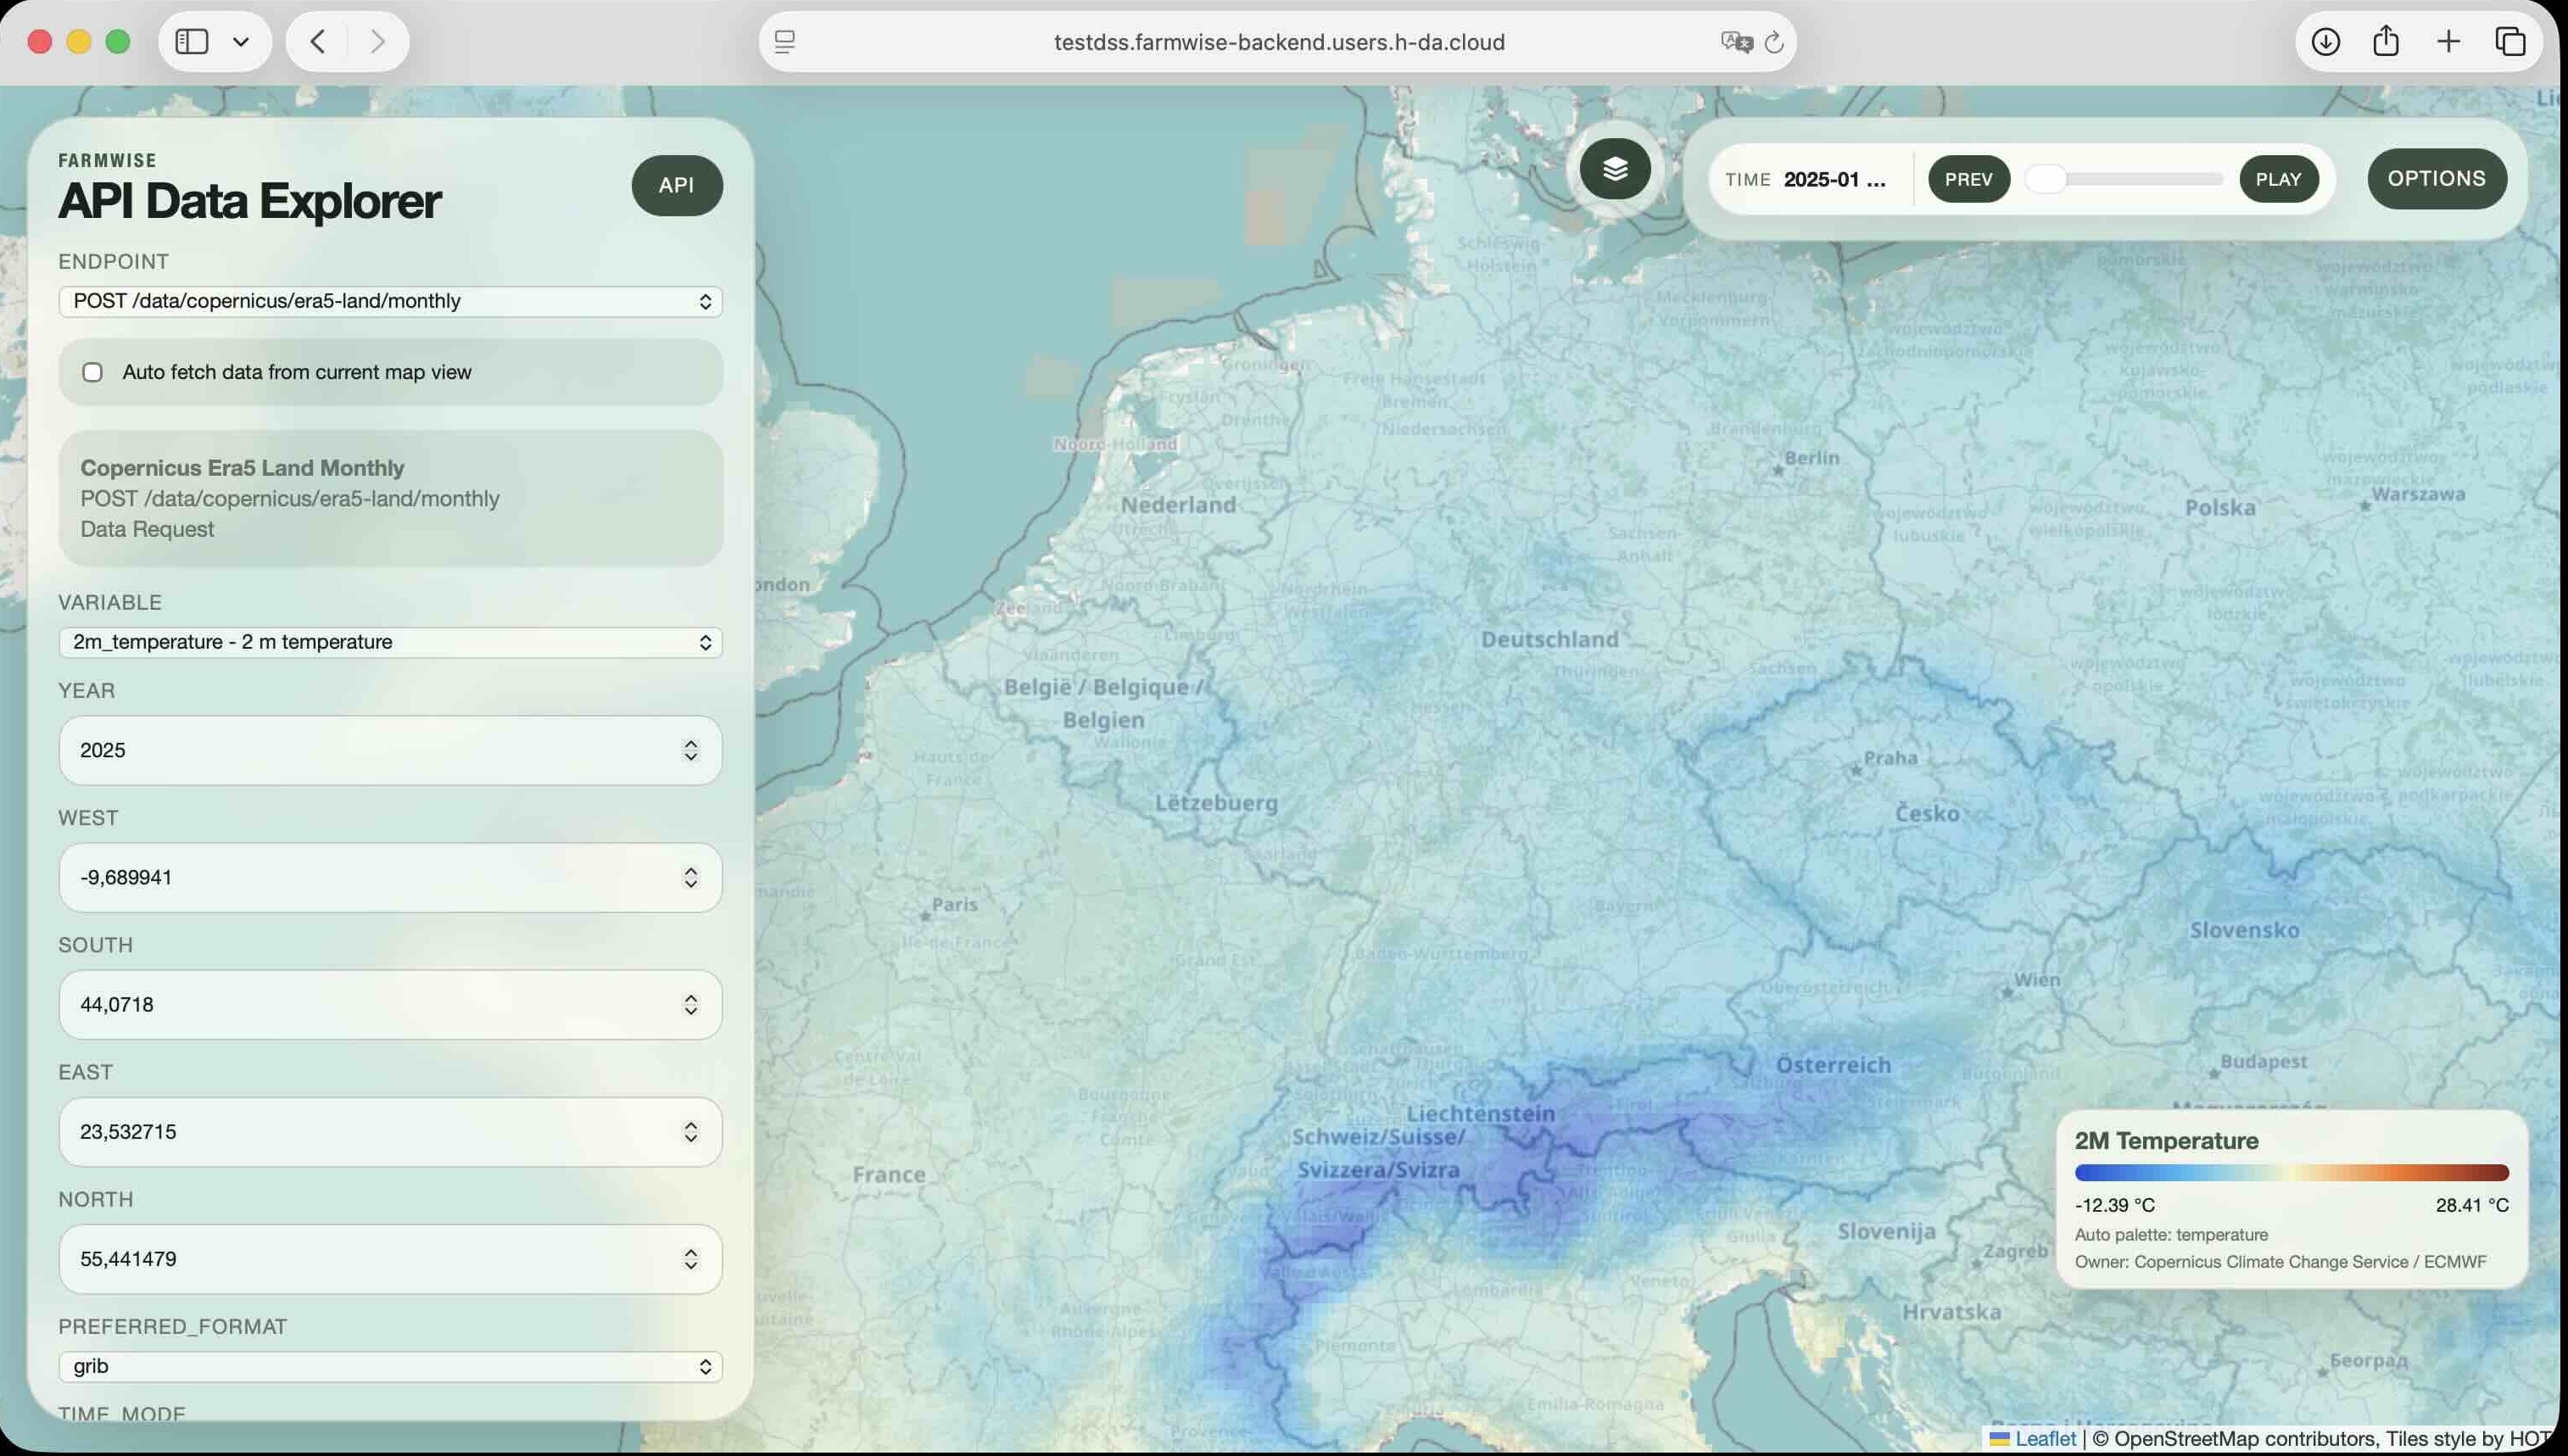
FARMWISE API Data Explorer (Tester)
API Data Explorer for geographical data
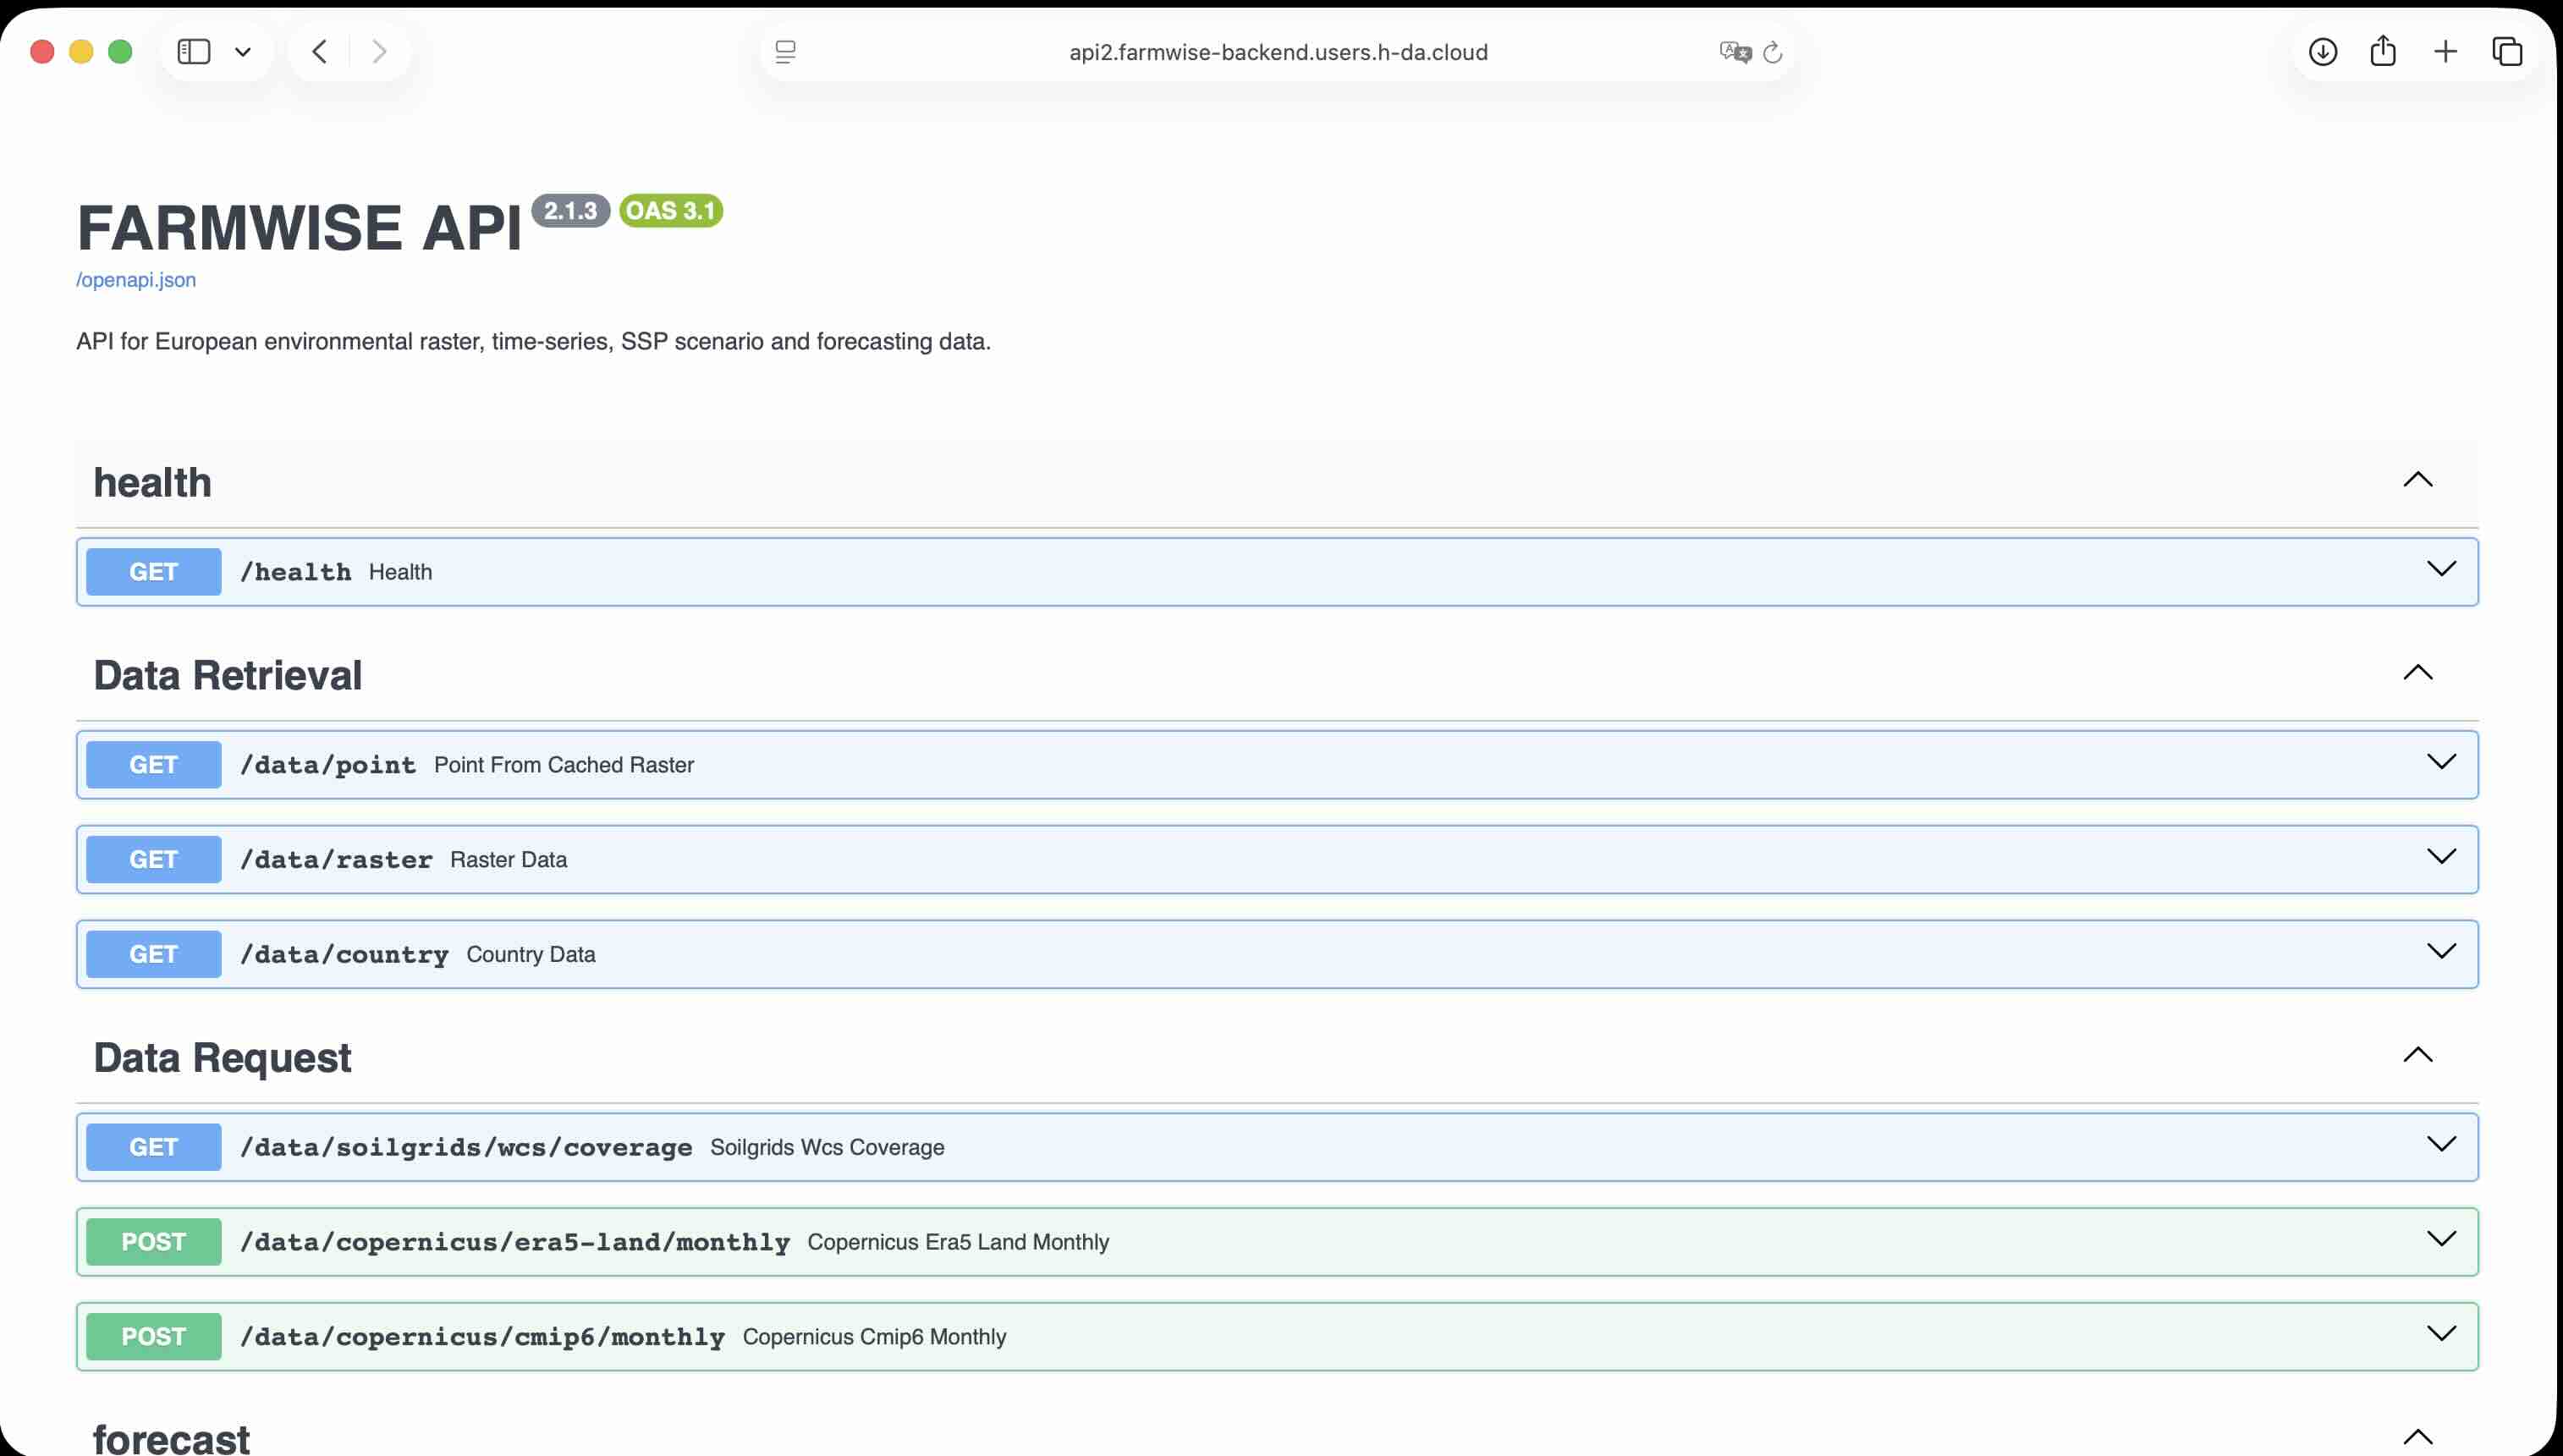
FARMWISE Data API V2.0
FARMWISE Data API V2.0 with data from Copernicus, Soilgrids, etc.
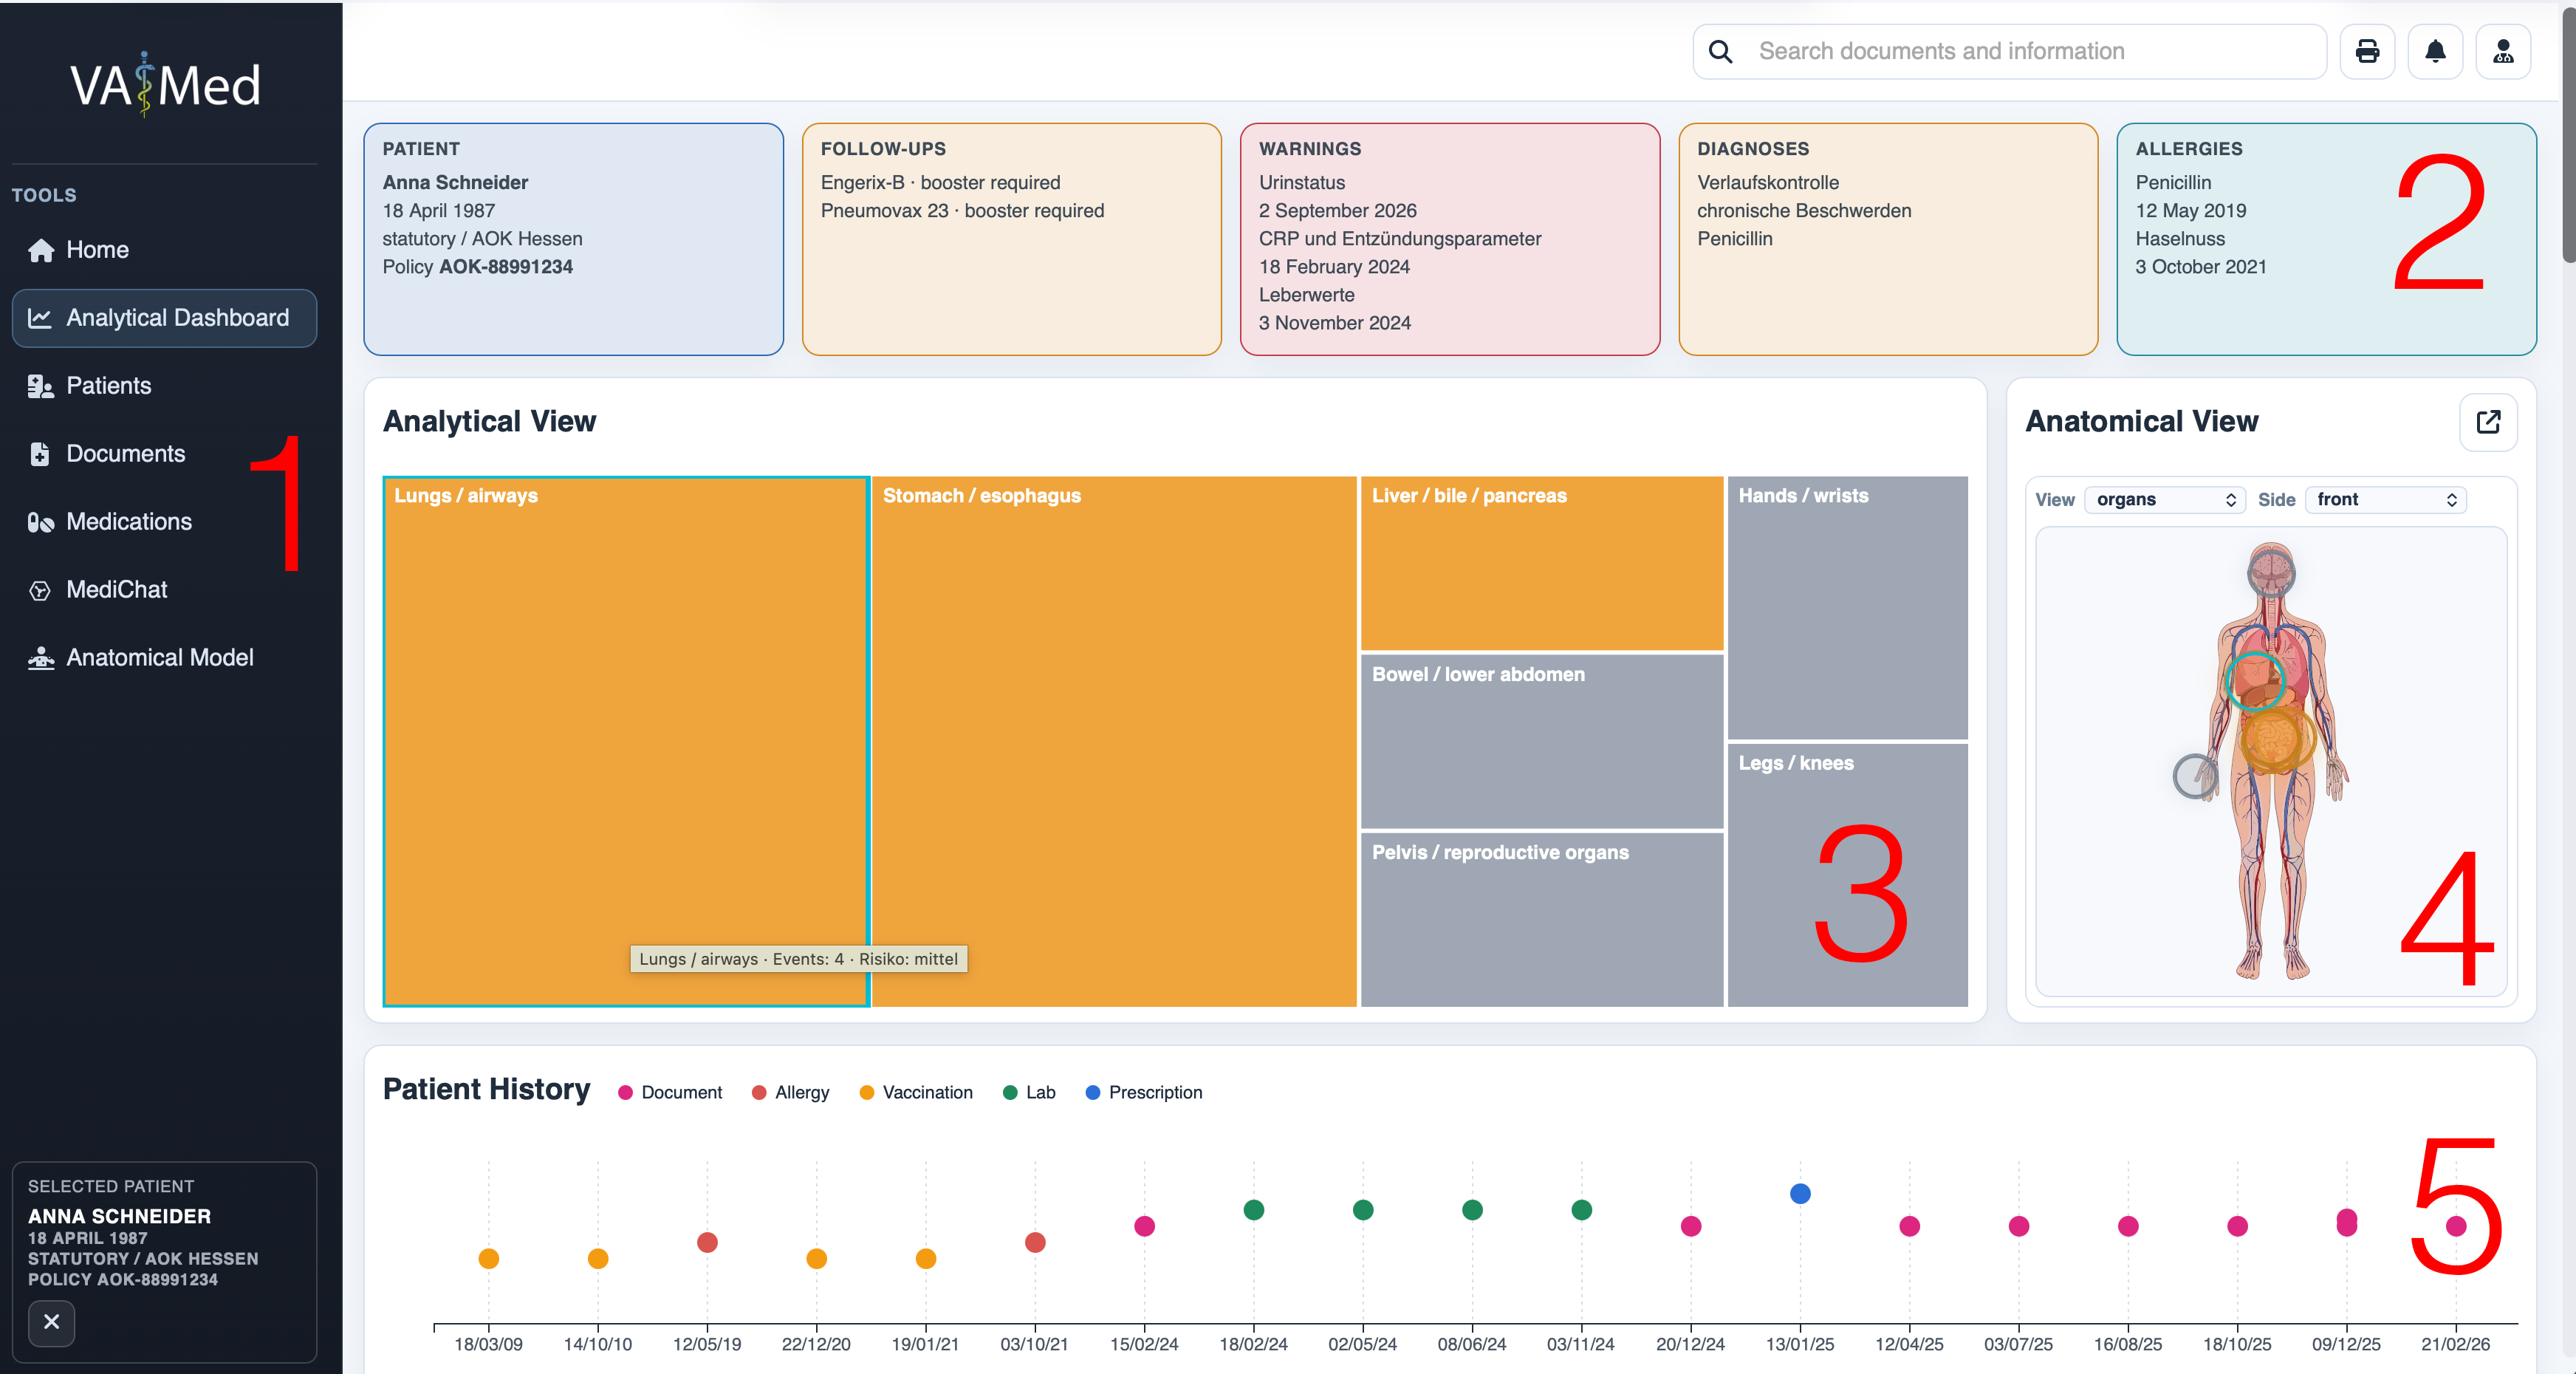
VaMed Dashboard V2
VaMed Dashboard V2 including MongoDB, Analytical Dashboard, Patients Panel, Documents Panel, Medication Panel, MediChat LLM, Anatomical Model.
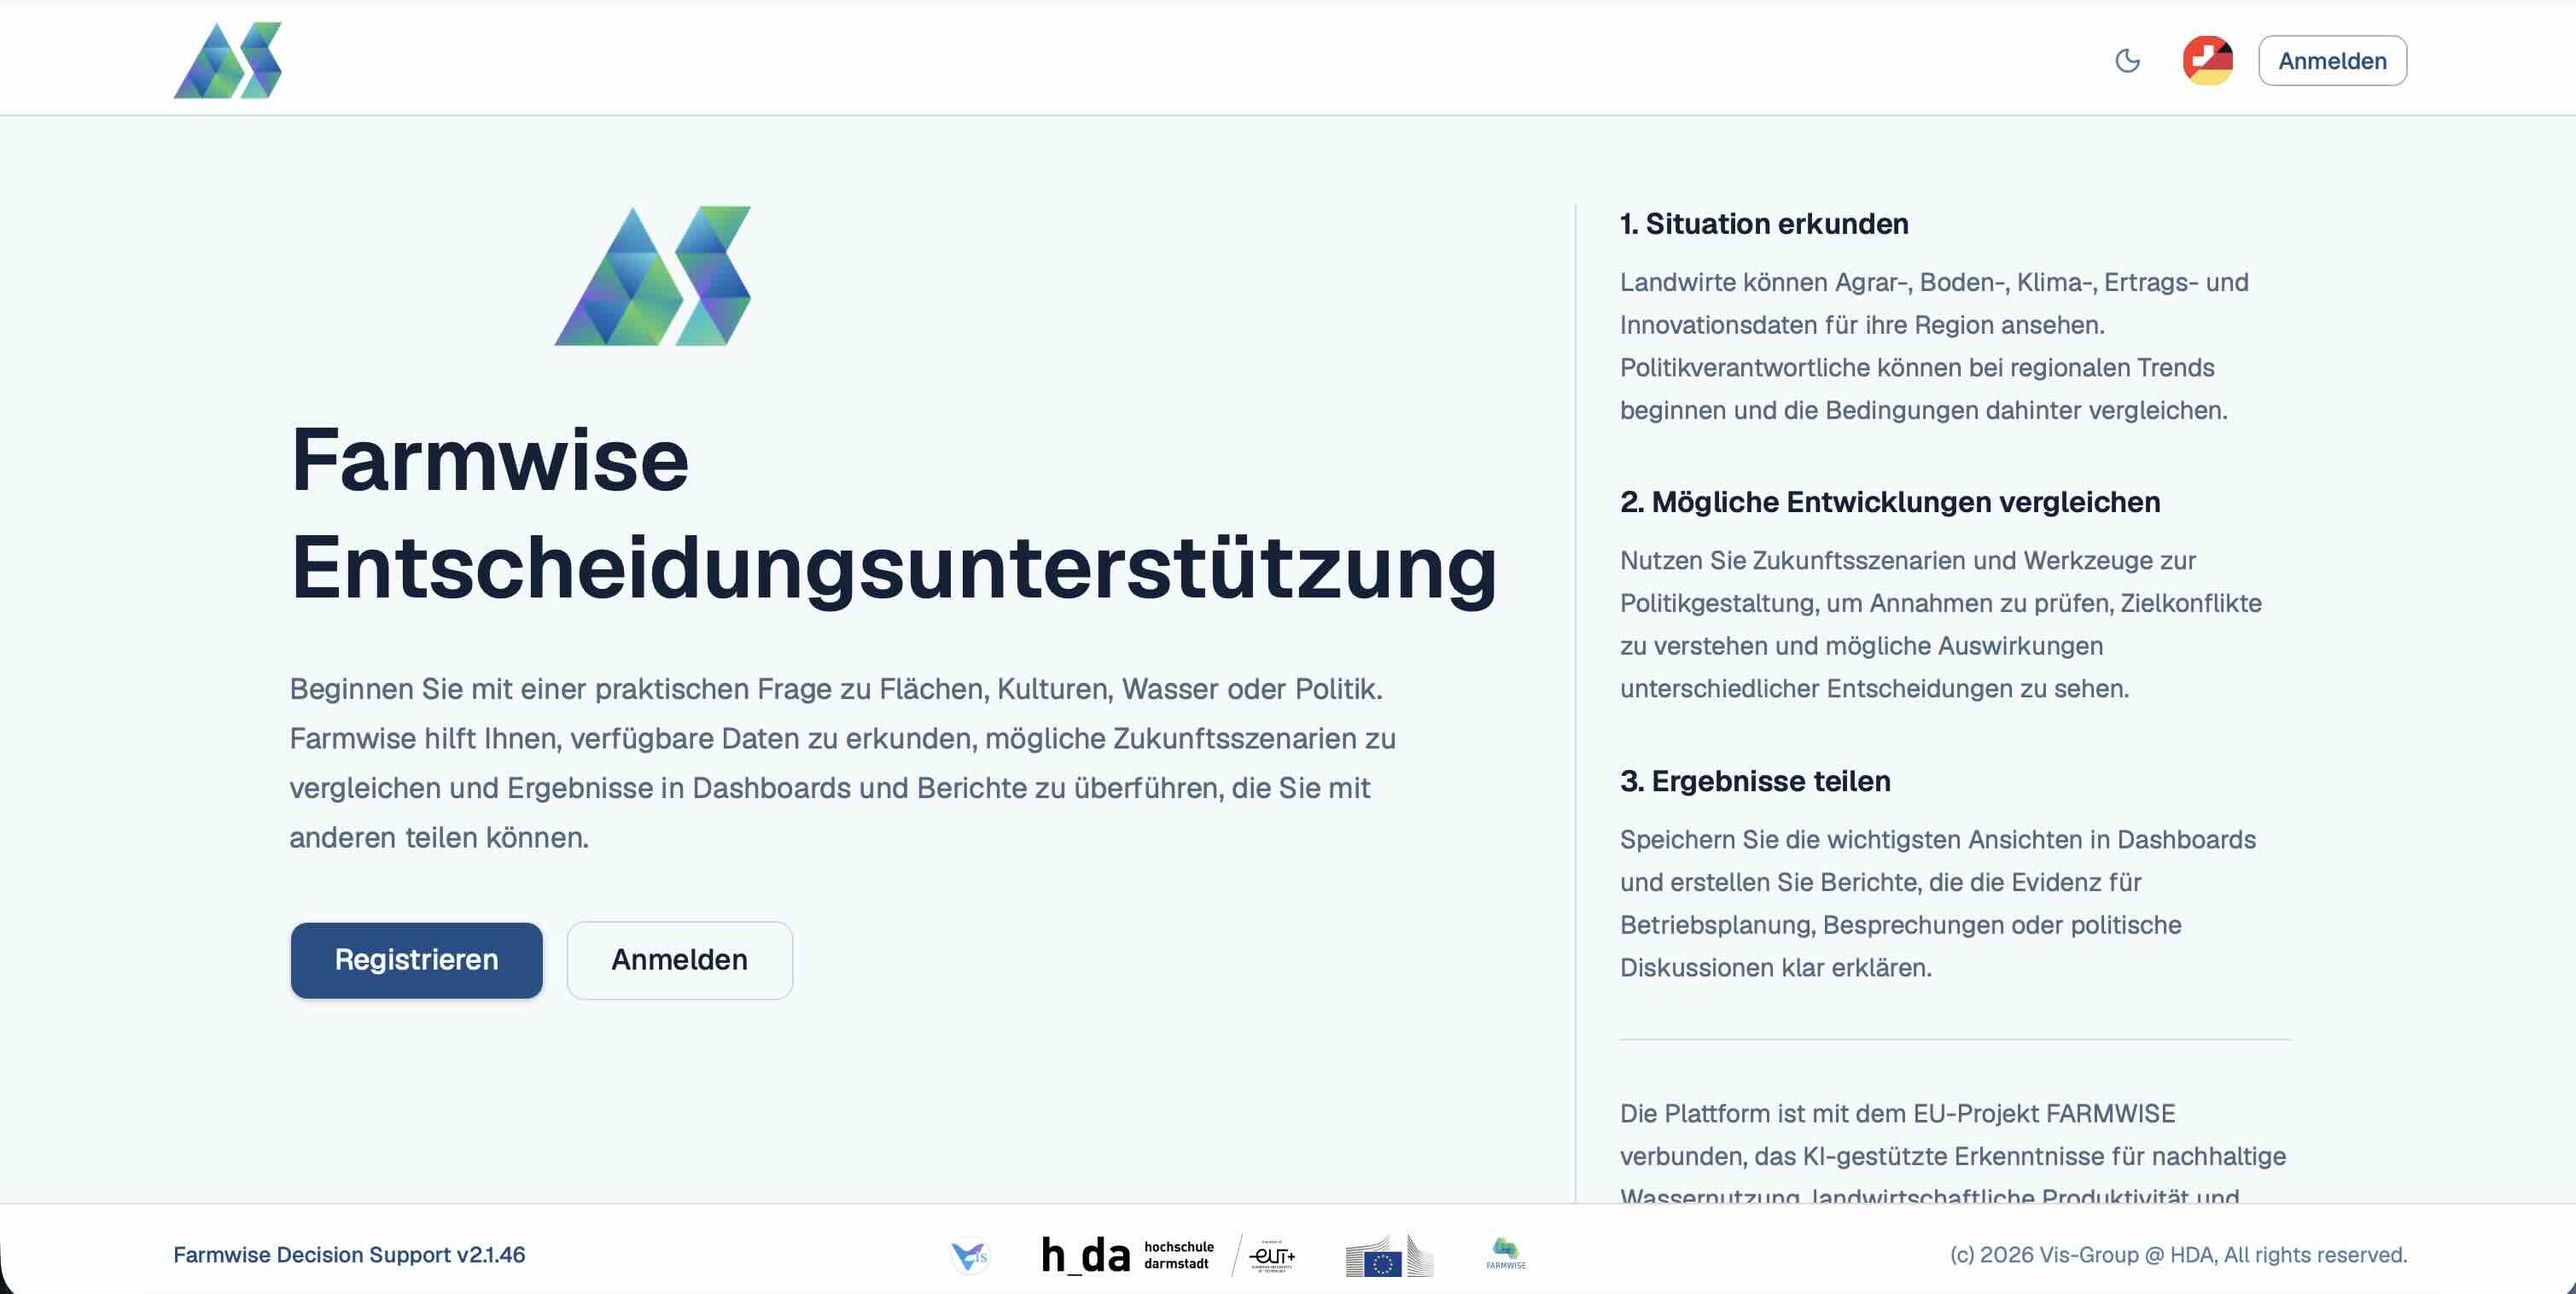
Farmwise Decision Support
Farmwise Decision Support Start with a practical question about land, crops, water, or policy. Farmwise helps you explore the available data, compare possible futures, and turn the results into dashboards and reports that can be shared with others.
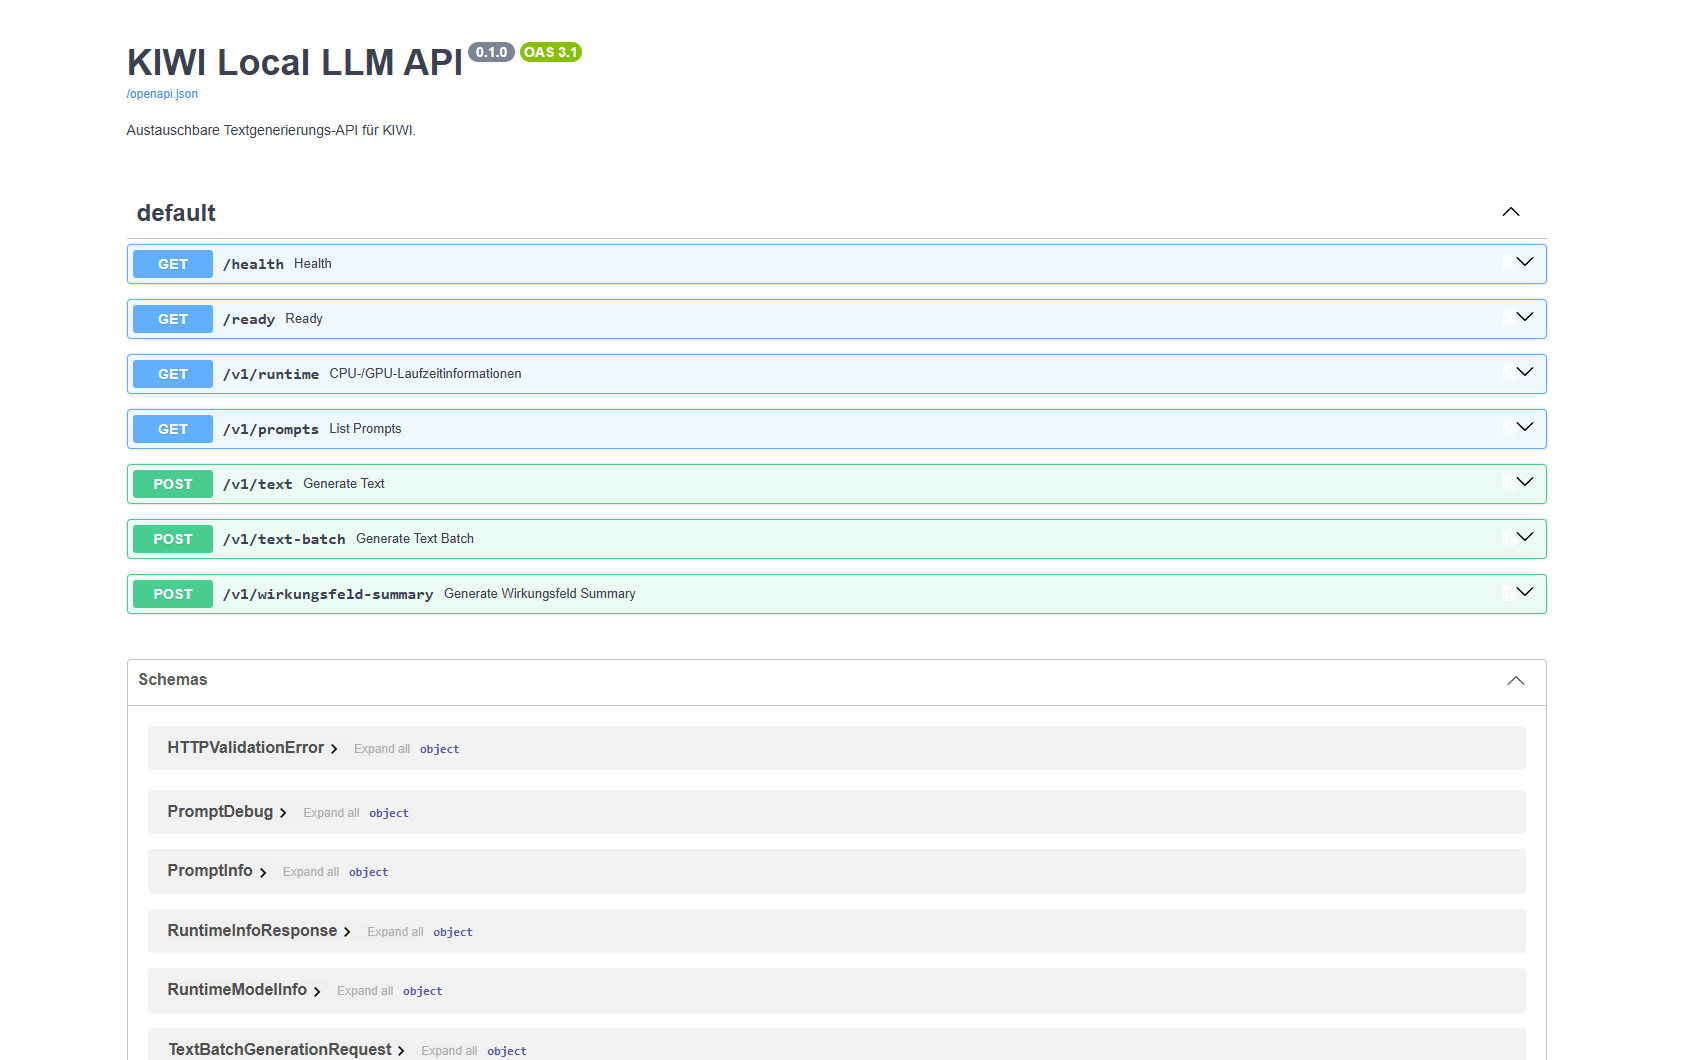
KIWI Local LLM API
LLM API fuer KIWI Berichtserstellung
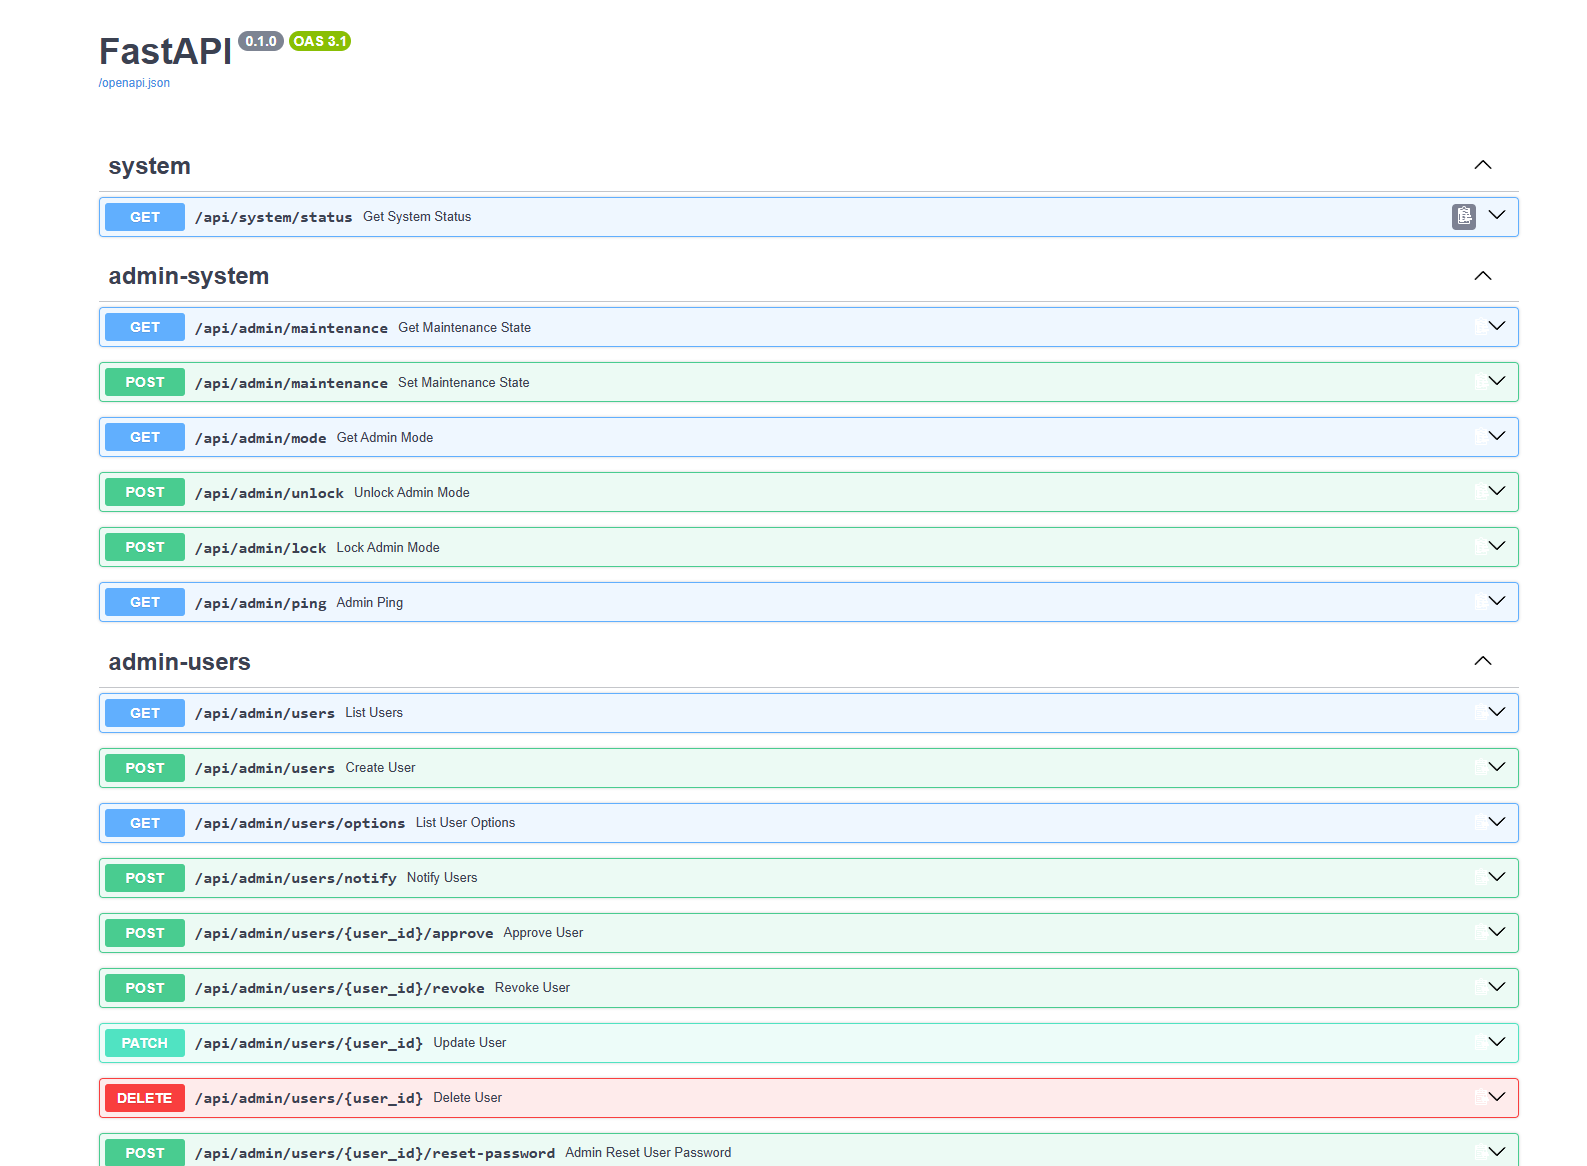
KIWI API
KIWI API
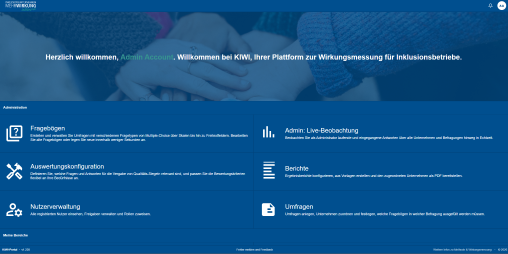
KIWI
KIWI-Pojekt
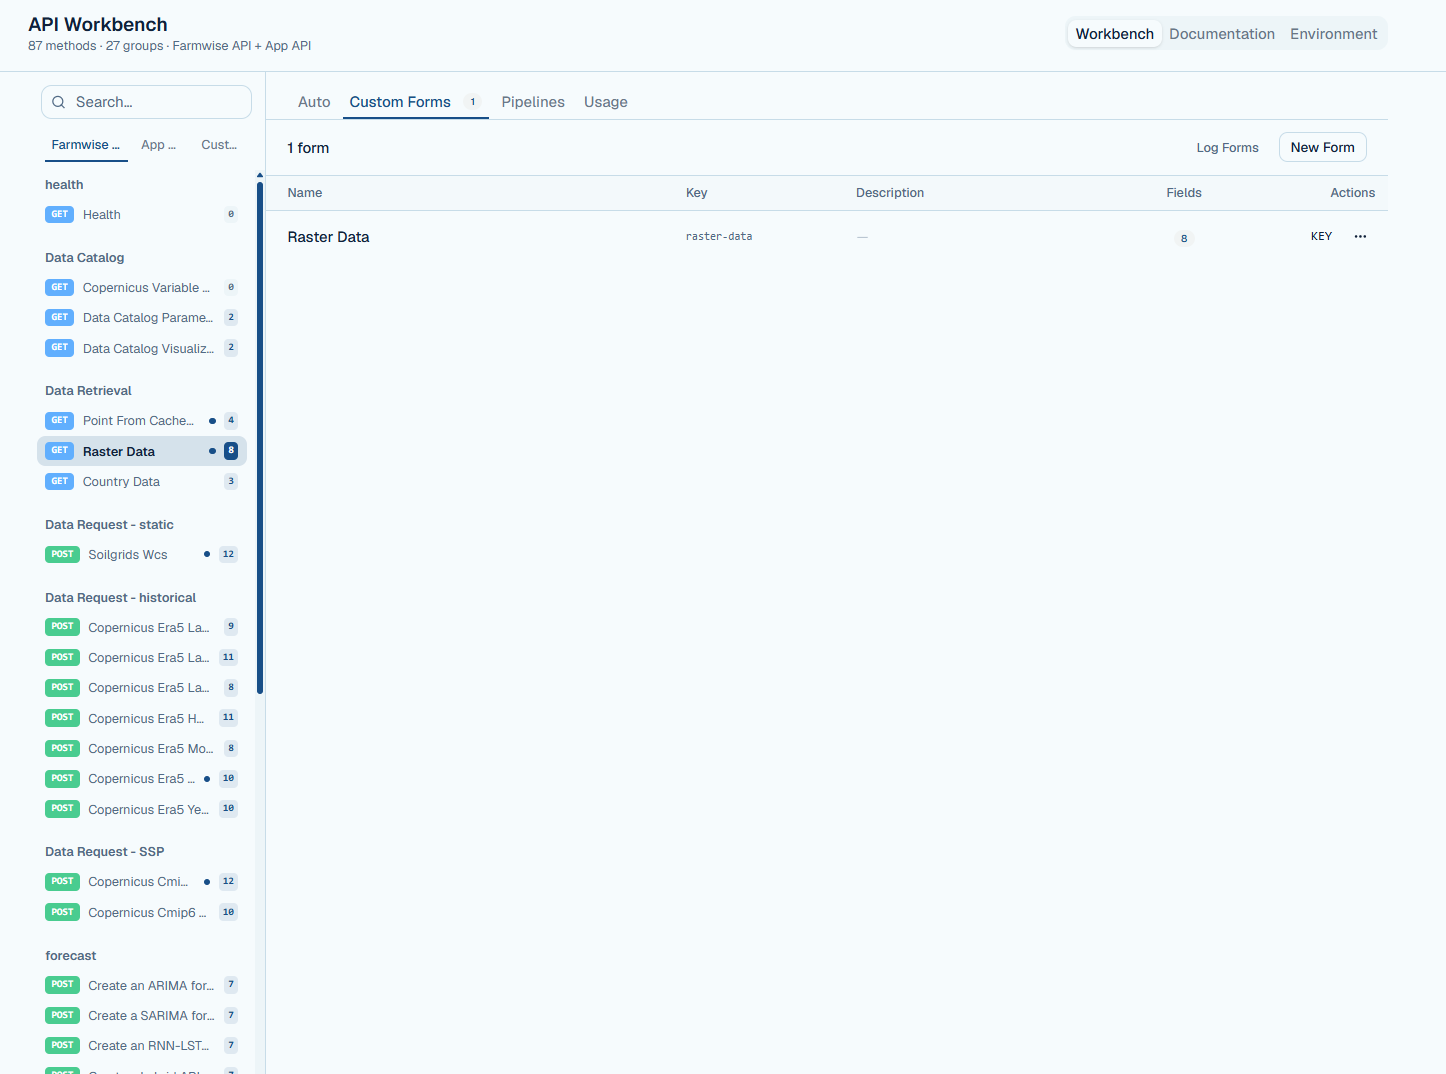
API Workbench
A flexible module for quickly integrating and managing API endpoints. Create request forms directly through the UI, store configurations in the database, and build complete multi-endpoint pipelines — including data whitelisting, validation, and normalization.
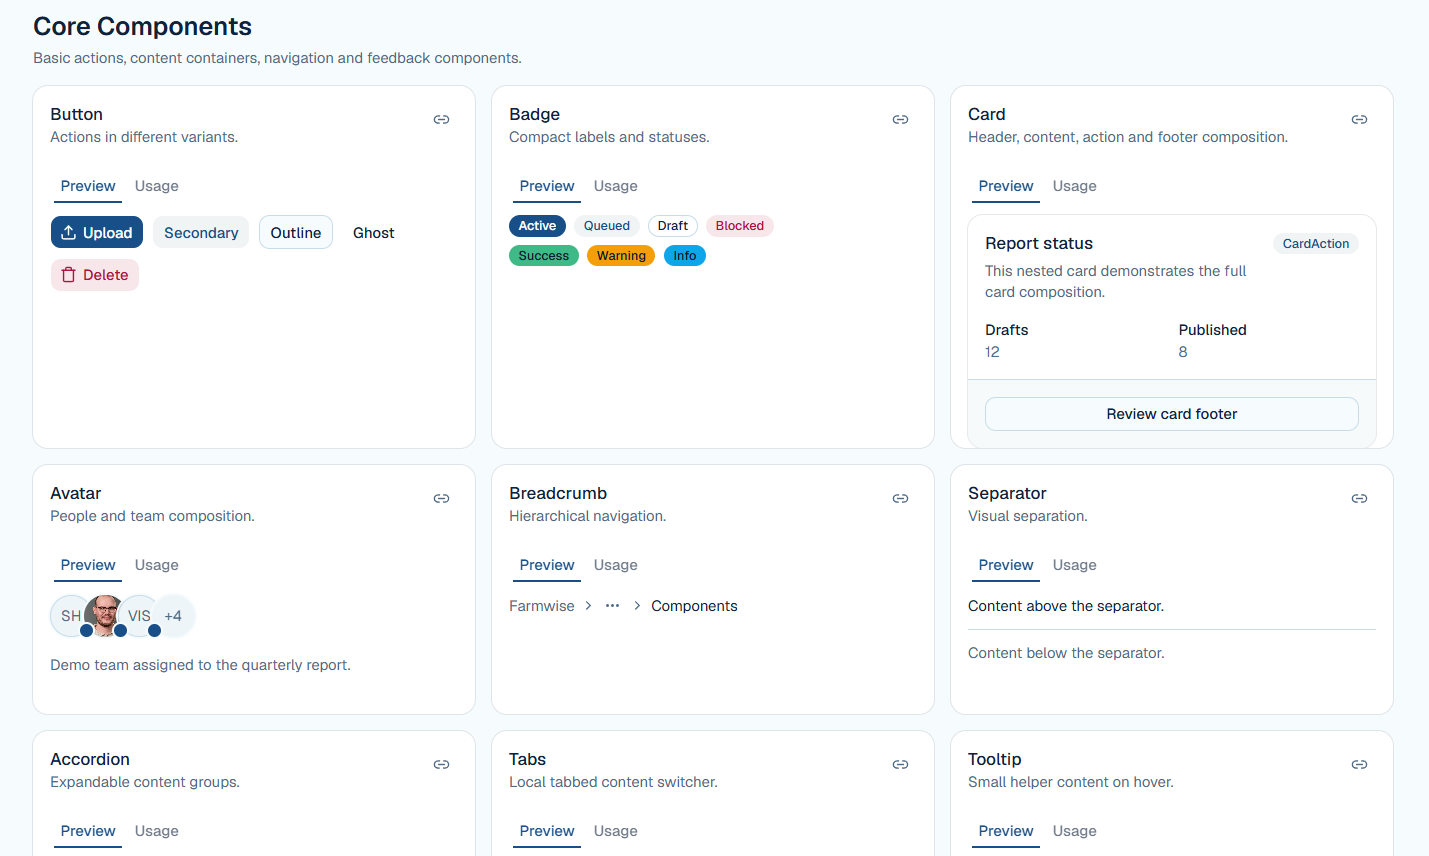
Custom Components Framework
A fully integrated, shadcn-based component framework for building and managing reusable custom UI components. Designed for seamless compatibility with the Theme Manager, enabling consistent styling, flexible customization, and rapid application development.
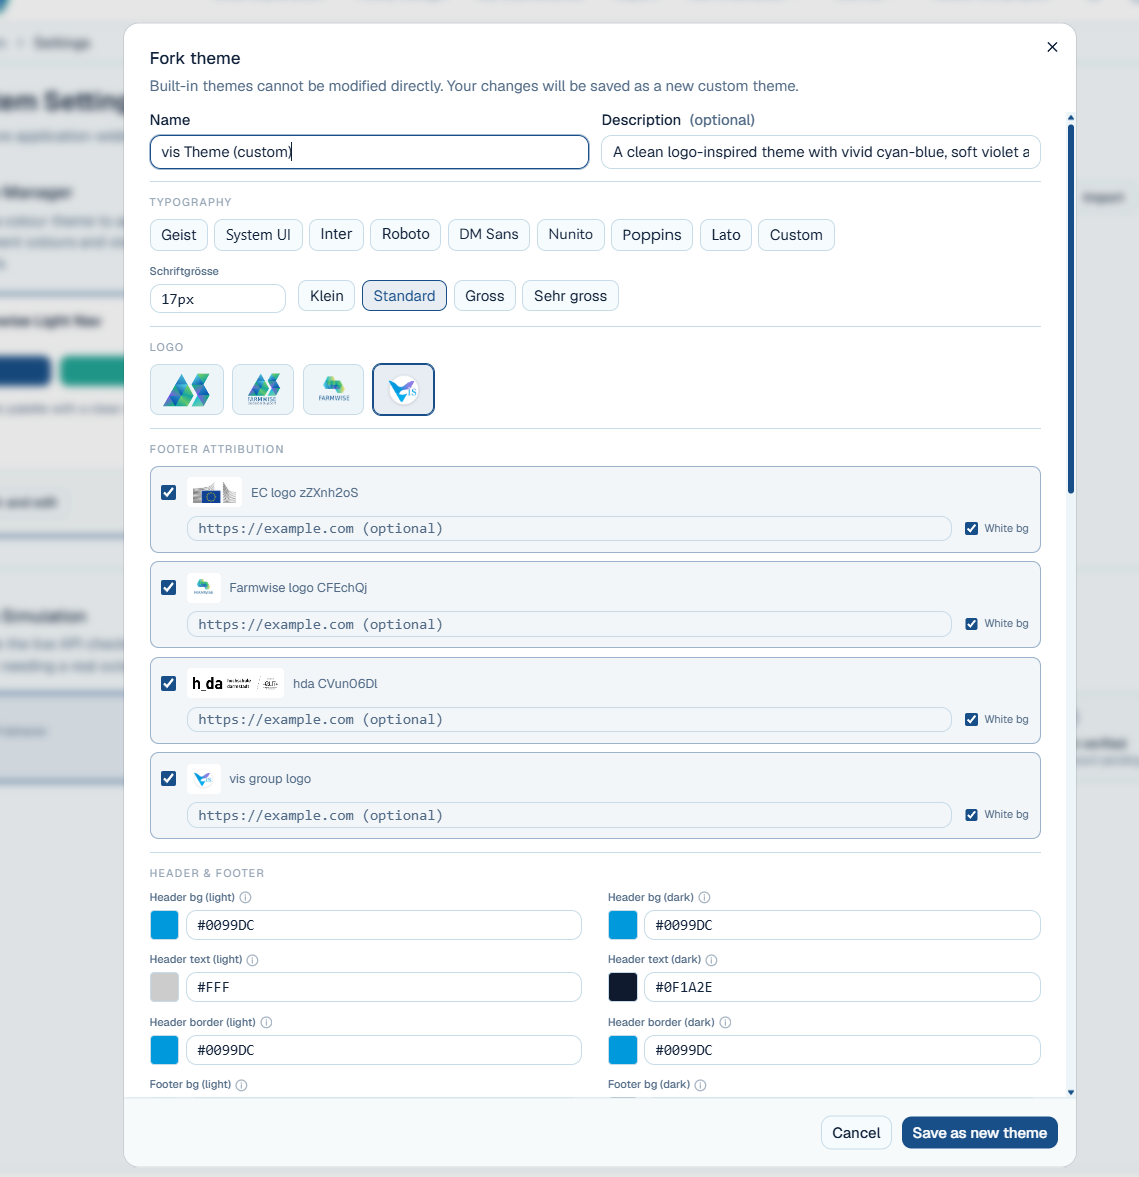
Theme Manager
A centralized theming system for creating, customizing, and managing application-wide visual styles. It generates standardized theme files covering colors, typography, logos, header and footer styling, and branding assets — fully compatible with the Custom Components Framework.
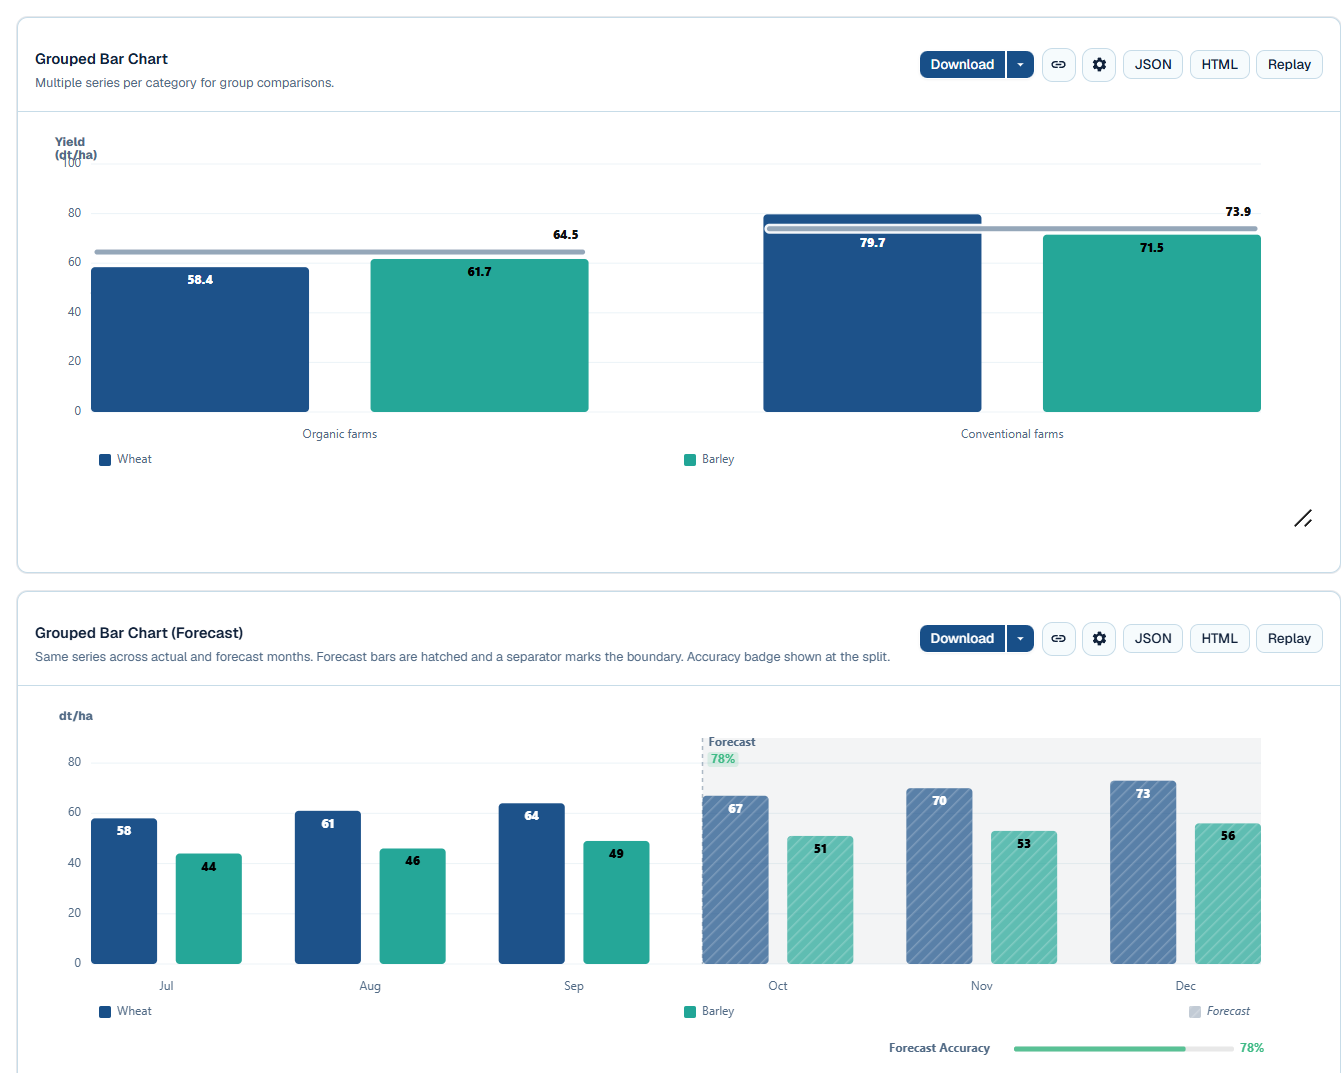
SimpleVizHub
A modular visualization framework for building charts, KPIs, and interactive dashboards from a standardized data model. It combines a unified rendering pipeline, data transforms, theming, dashboard composition, and export capabilities in one reusable package — designed for consistent integration across applications.
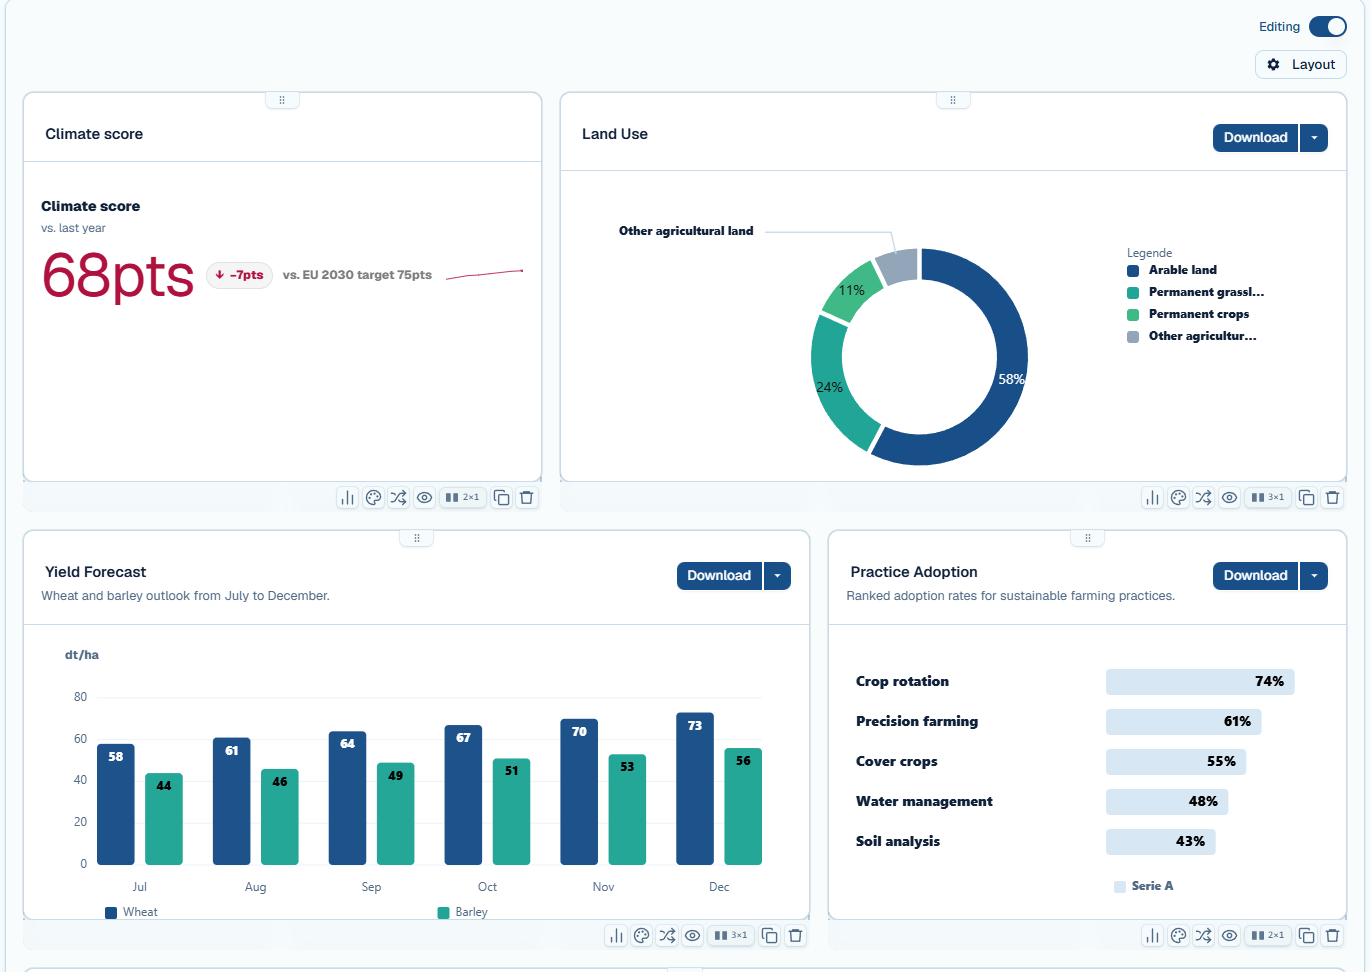
Dashboard Builder
A flexible dashboard composition system for creating interactive, data-driven layouts with charts, KPIs, text blocks, and reusable data sources. It supports drag-and-drop positioning, resizing, per-widget settings, transforms, filters, theming, and editable or read-only modes — all built on top of the shared SimpleVizHub rendering pipeline.